San Francisco Home Prices Stay Near Record Highs
Sean Mamola | May 14, 2026

Sean Mamola | May 14, 2026
San Francisco House Prices |
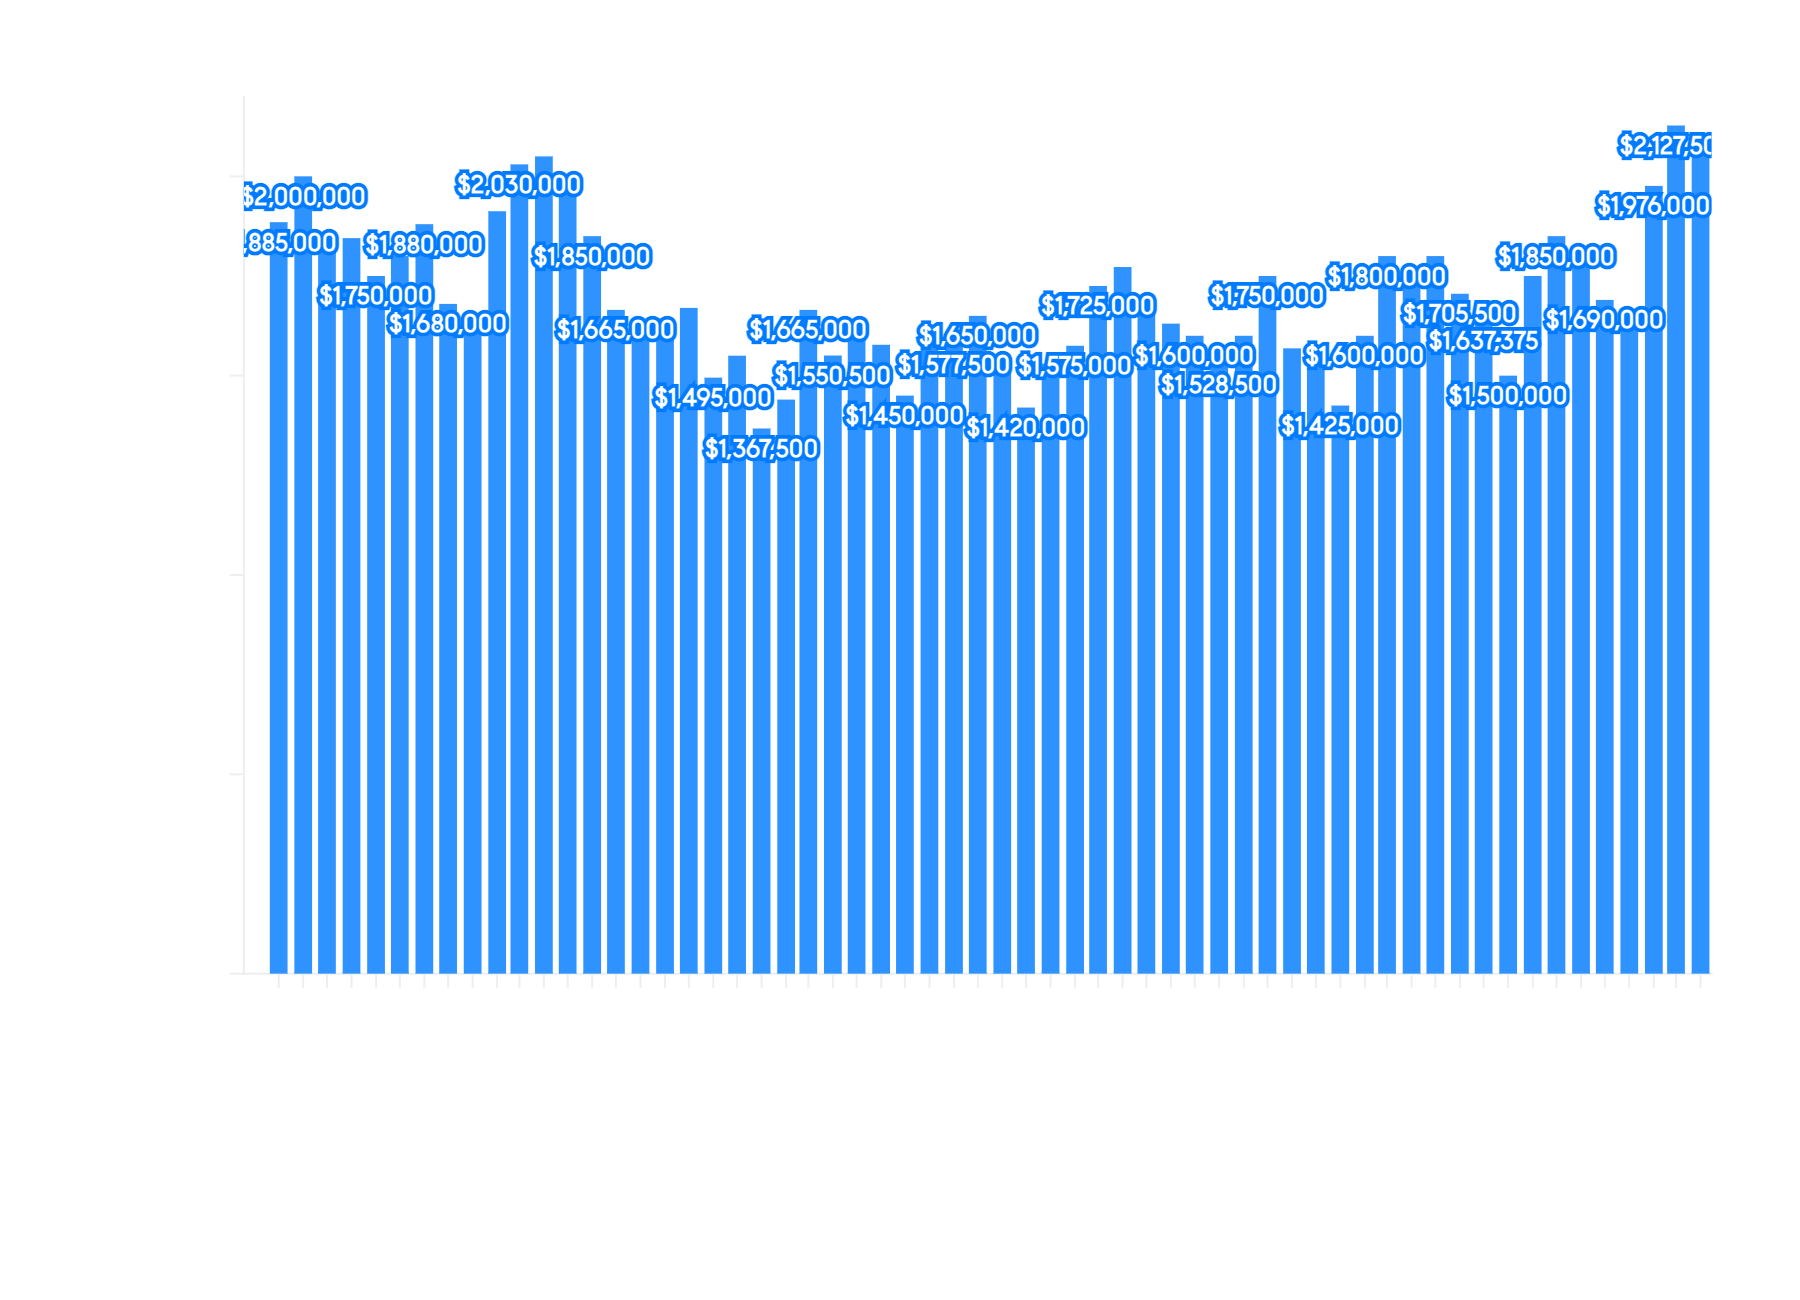
San Francisco’s housing market entered spring 2026 with remarkable force. The Compass May 2026 Market Report, which tracks data through April, shows median house prices holding at or near all-time highs for the second consecutive month, a feat that the city last achieved during the peak of spring 2022. But unlike that earlier run, which was fueled by pandemic-era demand and ultra-low rates, the current surge is playing out against a much tougher economic backdrop.
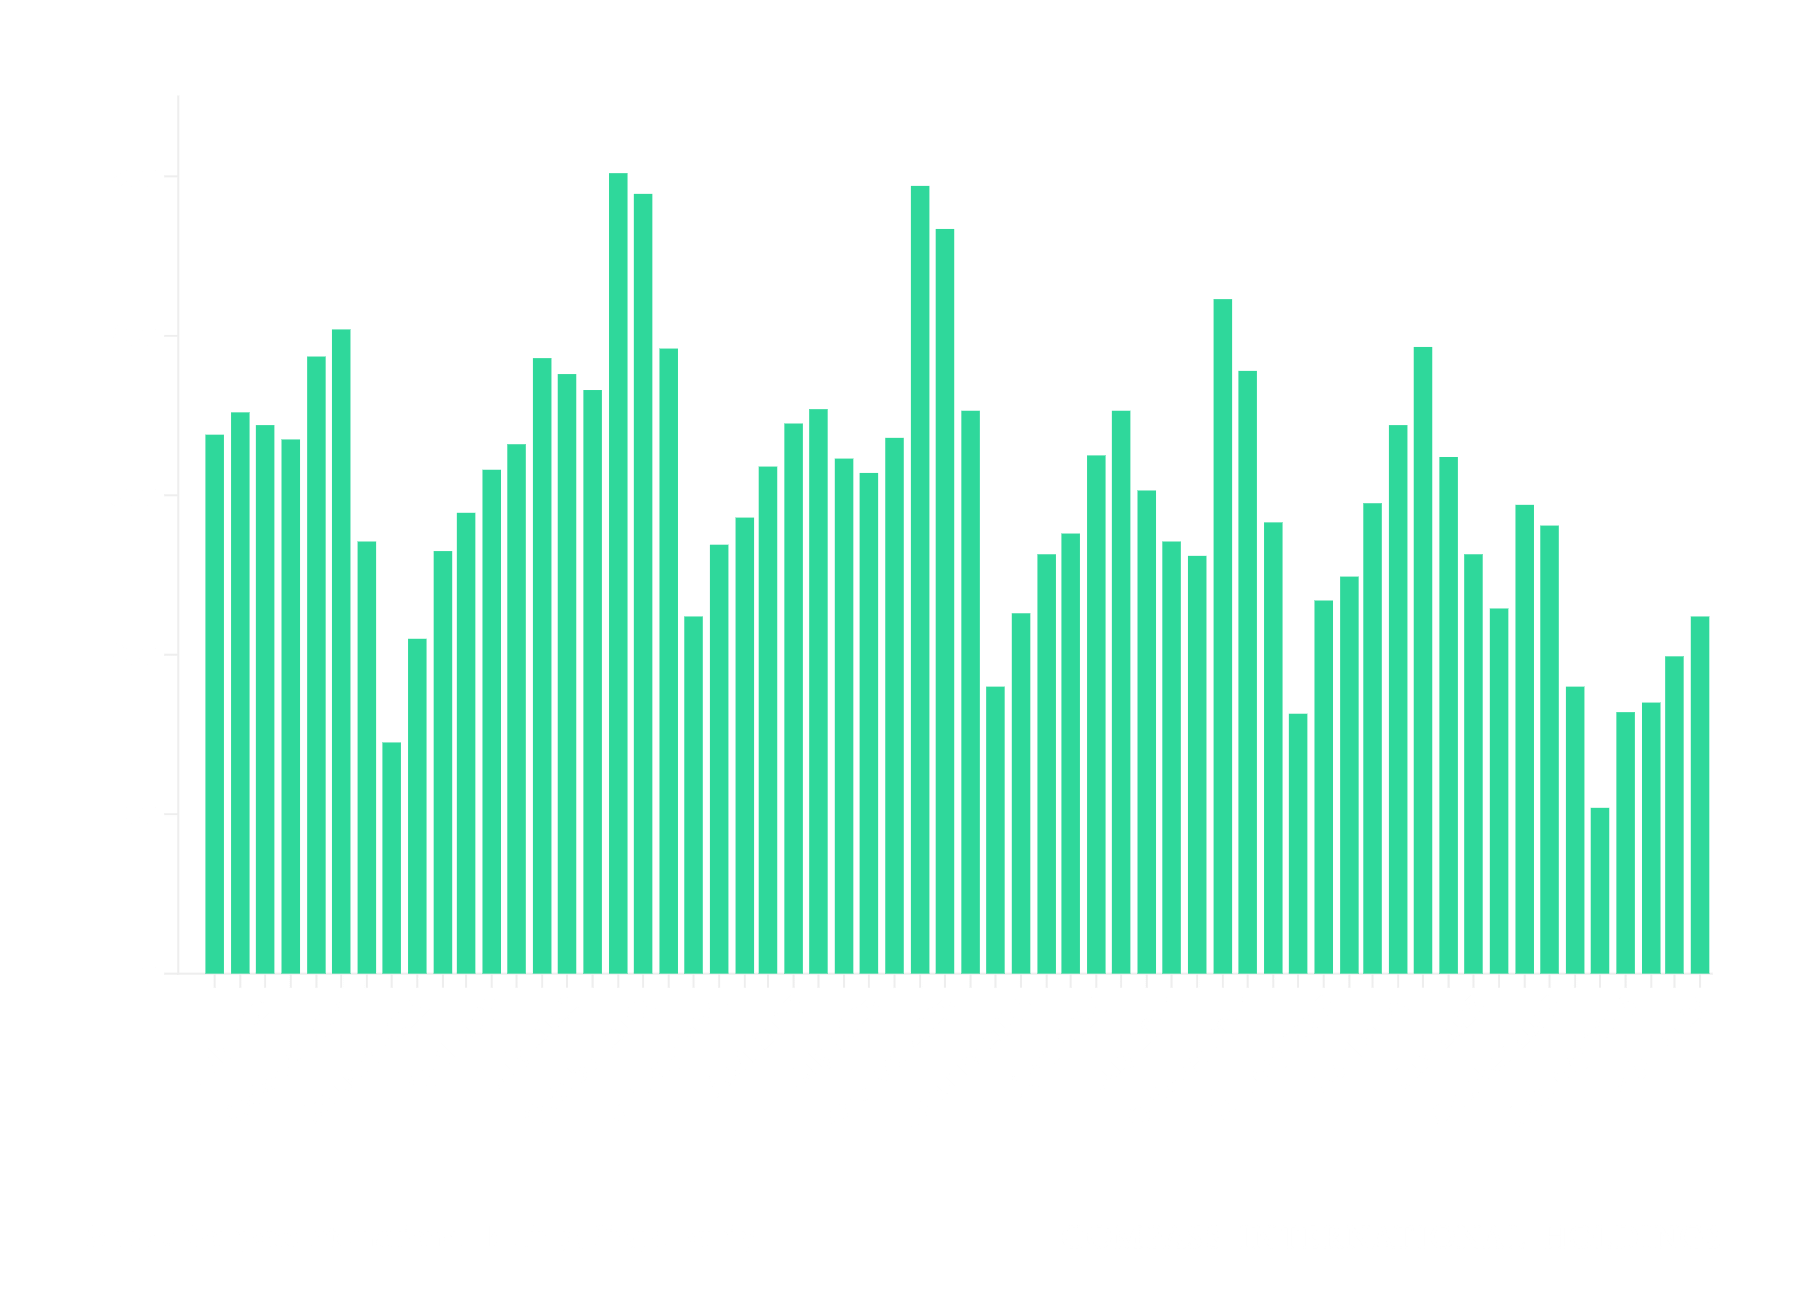
The defining metric of April’s market is the sale-to-list ratio, which climbed above 125% citywide. That means the typical house in San Francisco sold for more than a quarter above its list price, a level of bidding intensity not seen in four years. The historical trendline for this metric tells the story clearly: after bottoming out near 100% in late 2022 and early 2024, the ratio has climbed steadily and now shows a near-vertical spike into 2026.
“The overbidding data is the clearest signal we have right now,” observes Sean Mamola, Global Luxury Specialist with Compass. “It tells you that the buyers who are active are competing aggressively, and the sellers who aren’t listing are the reason why.”
San Francisco Median Price Per Square Foot |
Drilling into the neighborhood data reveals just how unevenly the heat is distributed. On the house side, Balboa Terrace posted the highest sale-to-list ratio at 166.6%, meaning homes there sold for nearly two-thirds above their asking price. Inner Sunset was close behind at 161.2%, followed by Outer Parkside at 145.7%, Peralta Heights at 142.6%, and Sea Cliff at 139.9%. The pattern runs deep into the mid-market: Lake Street (138.5%), West Portal (137.3%), Outer Sunset (136.7%), Glen Park (136.2%), and Parkside (135.2%) all posted overbids above 35%.
Sales volume tells a complementary story. Bernal Heights led the city with 16 house sales in April, followed by Noe Valley at 14, Excelsior at 13, and Portola at 12. These are the neighborhoods where inventory, while still limited, is sufficient to generate a meaningful sample of transactions, and the overbidding percentages in each confirm that demand is absorbing supply quickly.
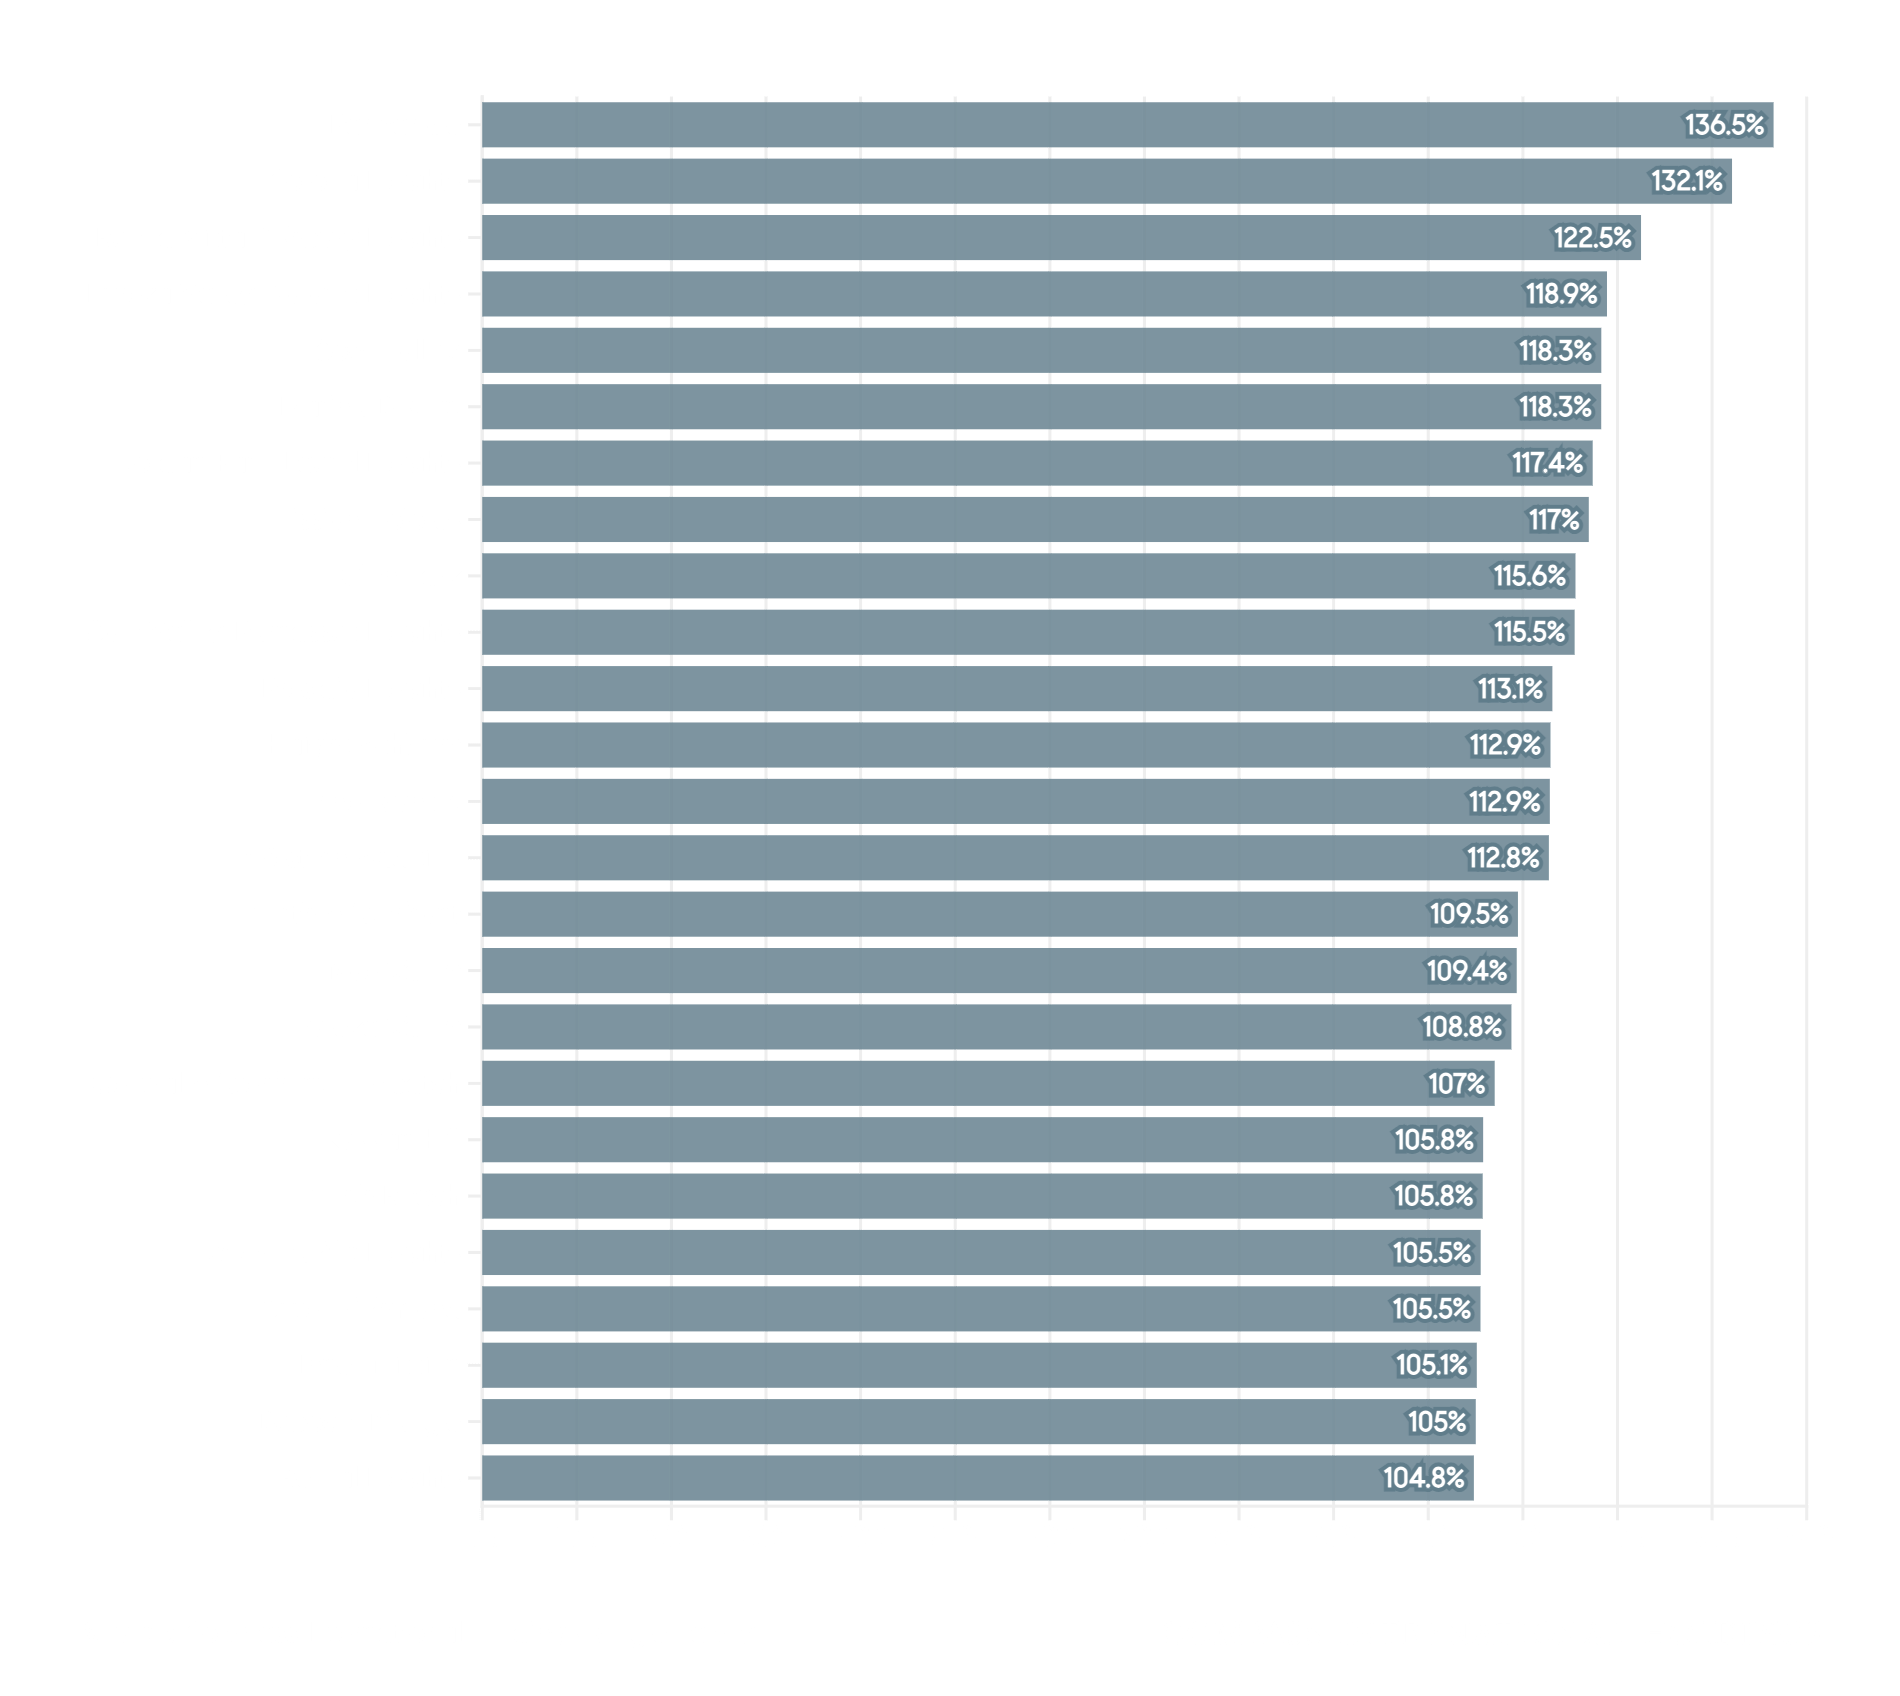
On the condo side, the momentum is more concentrated. Russian Hill led with 14 sales, followed by Yerba Buena at 13 and Van Ness/Civic Center at 10. Overbidding in the condo market is spreading as well: Panhandle condos sold at 136.5% of list, Corona Heights at 132.1%, and Buena Vista-Ashbury Heights at 122.5%.
“The condo market is telling a different story this spring than it was even six months ago,” notes Mamola. “When you see Panhandle condos selling at 136% of list, that’s not a correction bounce. That’s genuine demand meeting limited supply.”
San Francisco Condo Sold/List% |
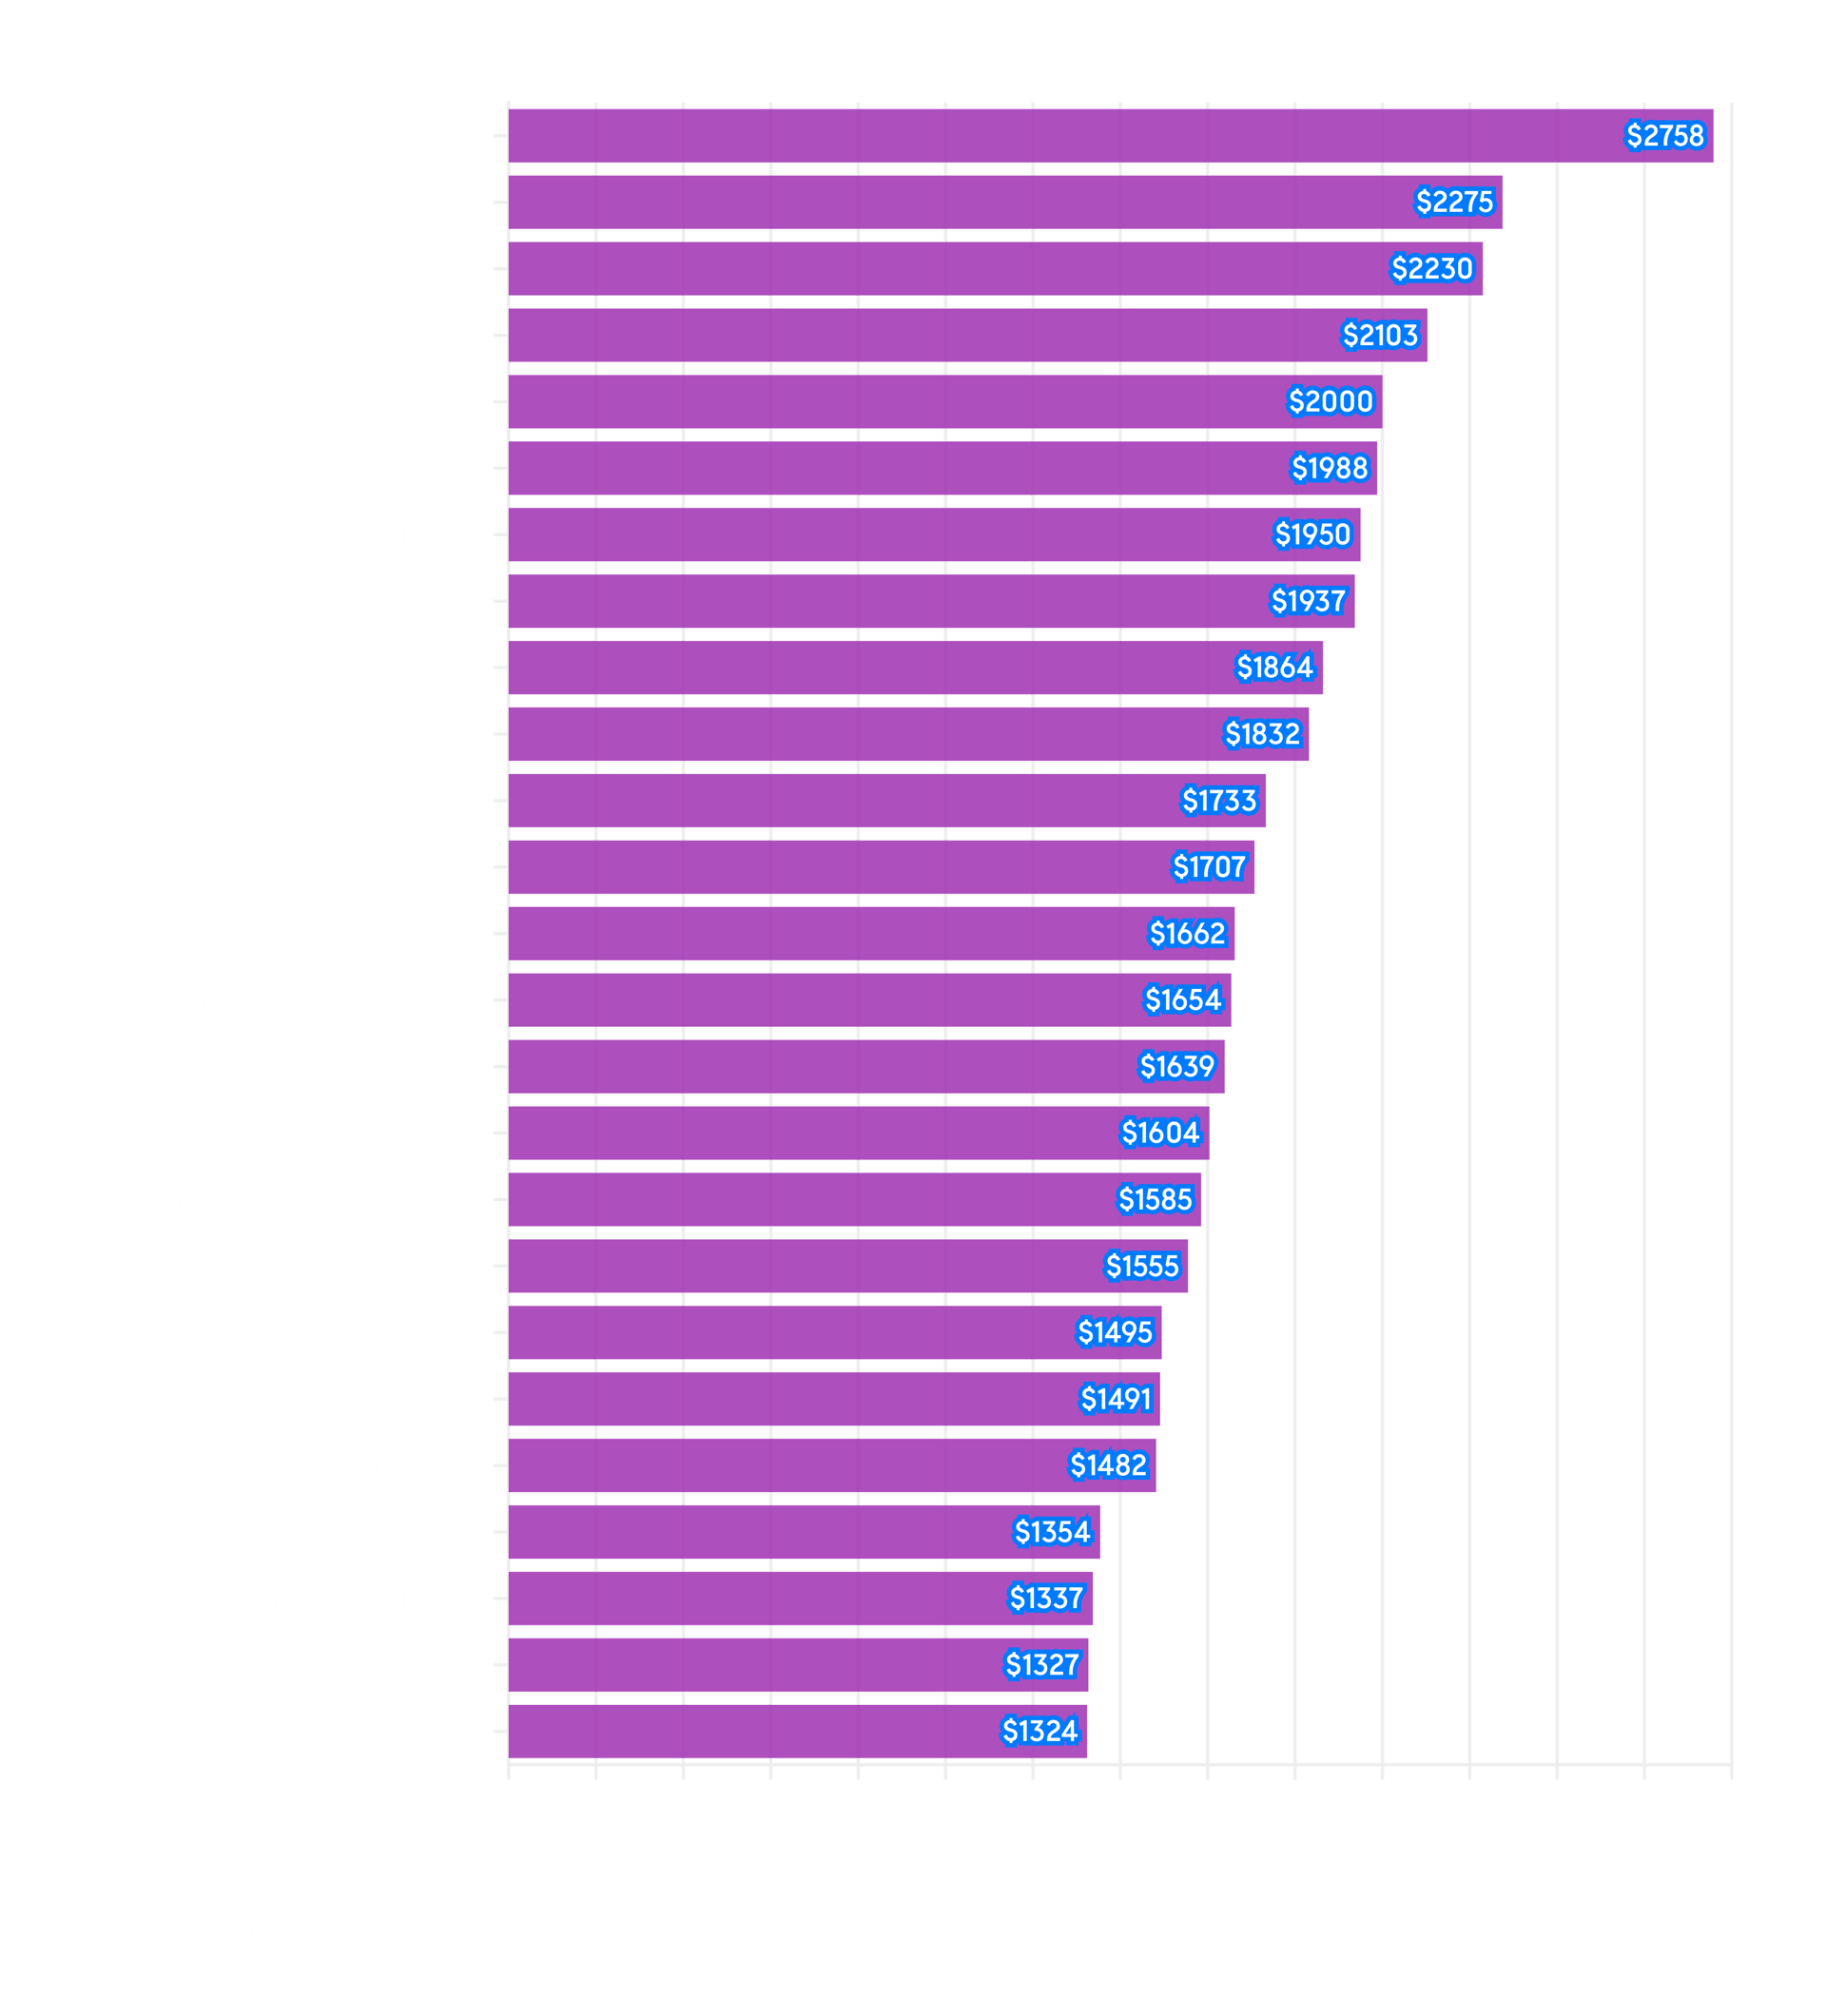
The neighborhood pricing data underscores San Francisco’s extraordinary range. On the house side, Cow Hollow led the city at a median of $9,750,000, followed by Sea Cliff at $8,225,000, Presidio Heights at $8,025,000, and the Presidio at $7,950,000. Russian Hill came in at $6,600,000, while the Marina District posted $5,600,000.
The mid-market tells its own story. Bernal Heights, the city’s most active neighborhood by sales volume, posted a median of $1,825,000. Pacific Heights came in at $1,820,000, while Inner Richmond hit $1,800,000 and Outer Parkside landed at $1,650,000. At the more affordable end, Crocker Amazon posted $1,263,000, Bayview $1,275,000, and Portola $1,305,000.
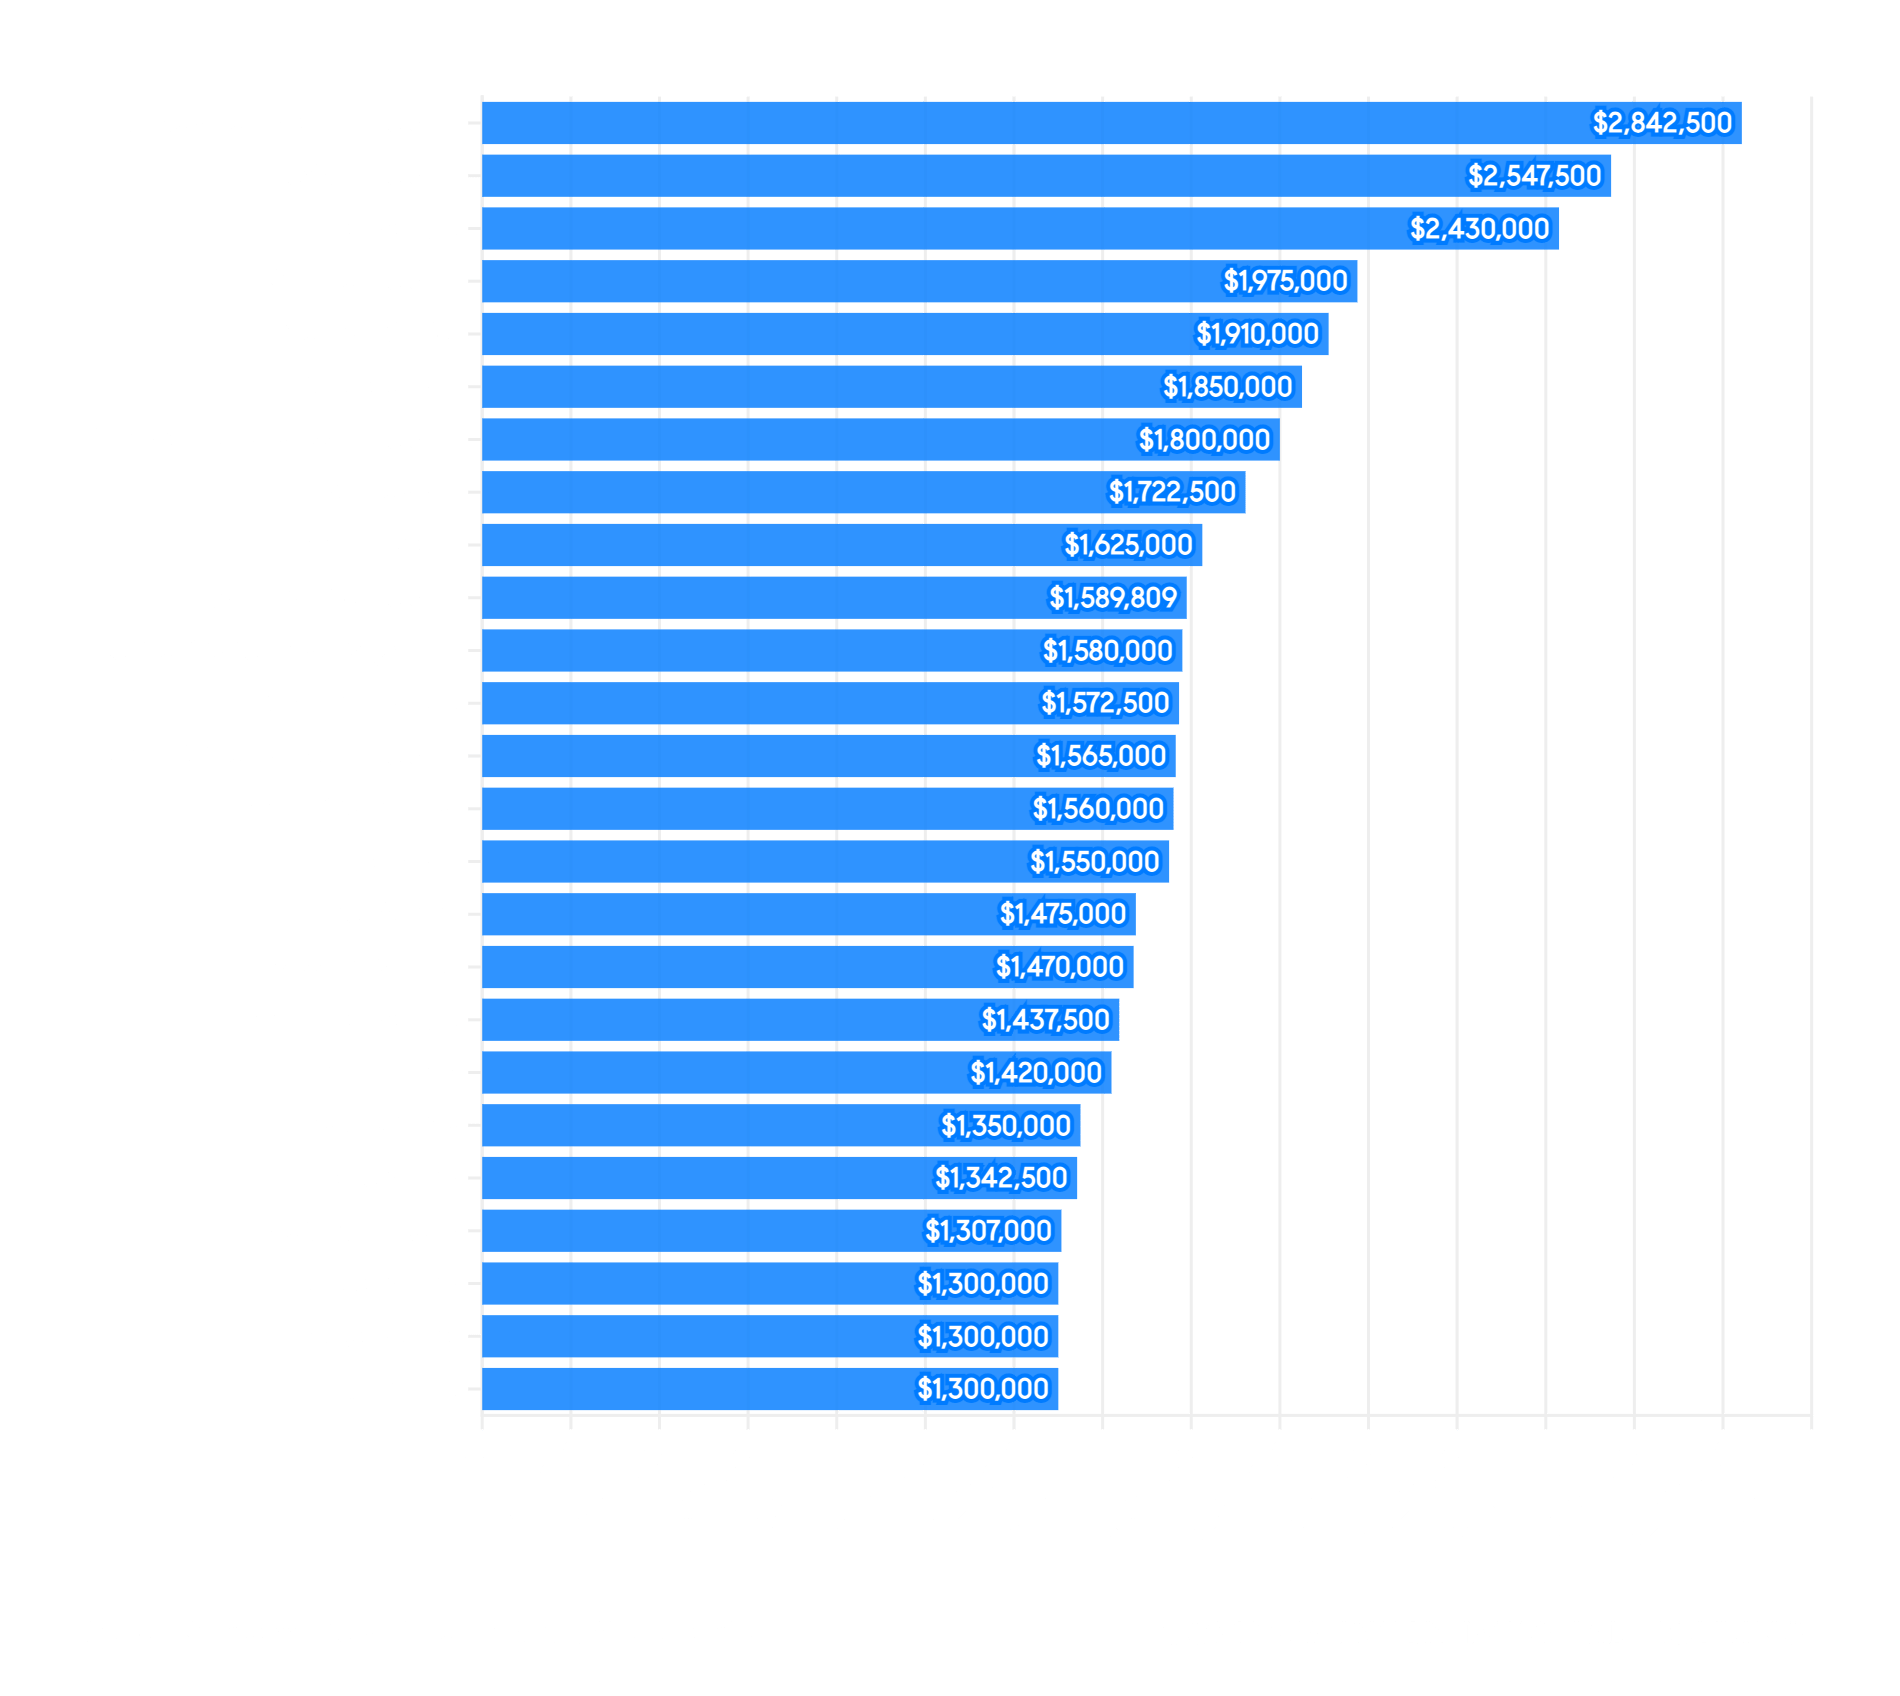
Condo pricing showed its own premium geography. Jordan Park-Laurel Heights led at $2,842,500, followed by Presidio Heights at $2,547,500 and Panhandle at $2,430,000. Lower Pacific Heights condos posted $1,589,809, while Central Waterfront-Dogpatch came in at $1,580,000 and Nob Hill at $1,550,000. On the price-per-square-foot basis, Cow Hollow led the condo market at $1,873/sqft, followed by Presidio Heights at $1,684 and Corona Heights at $1,614.
San Francisco Condo Prices |
The strength of San Francisco’s local numbers becomes even more striking when set against the national economic picture. The Compass report’s chief economist, Mike Simonsen, frames the moment as one where positive momentum is meeting economic crosswinds, and the data bears that out on both sides.
On the positive side: the hiring rate rebounded to 3.5% in April after a dismal stretch through the first quarter, according to BLS JOLTS data. Initial jobless claims printed at 190,000 for the week ending April 25, matching pre-pandemic lows and signaling sustained labor market tightness. Nonfarm payrolls added 115,000 jobs in April per the BLS employment report, well below 2023 averages but positive after multiple months of outright job losses in late 2025. Foreclosures remain near historic lows at 52,800 nationally in Q2 2025, according to New York Fed data.
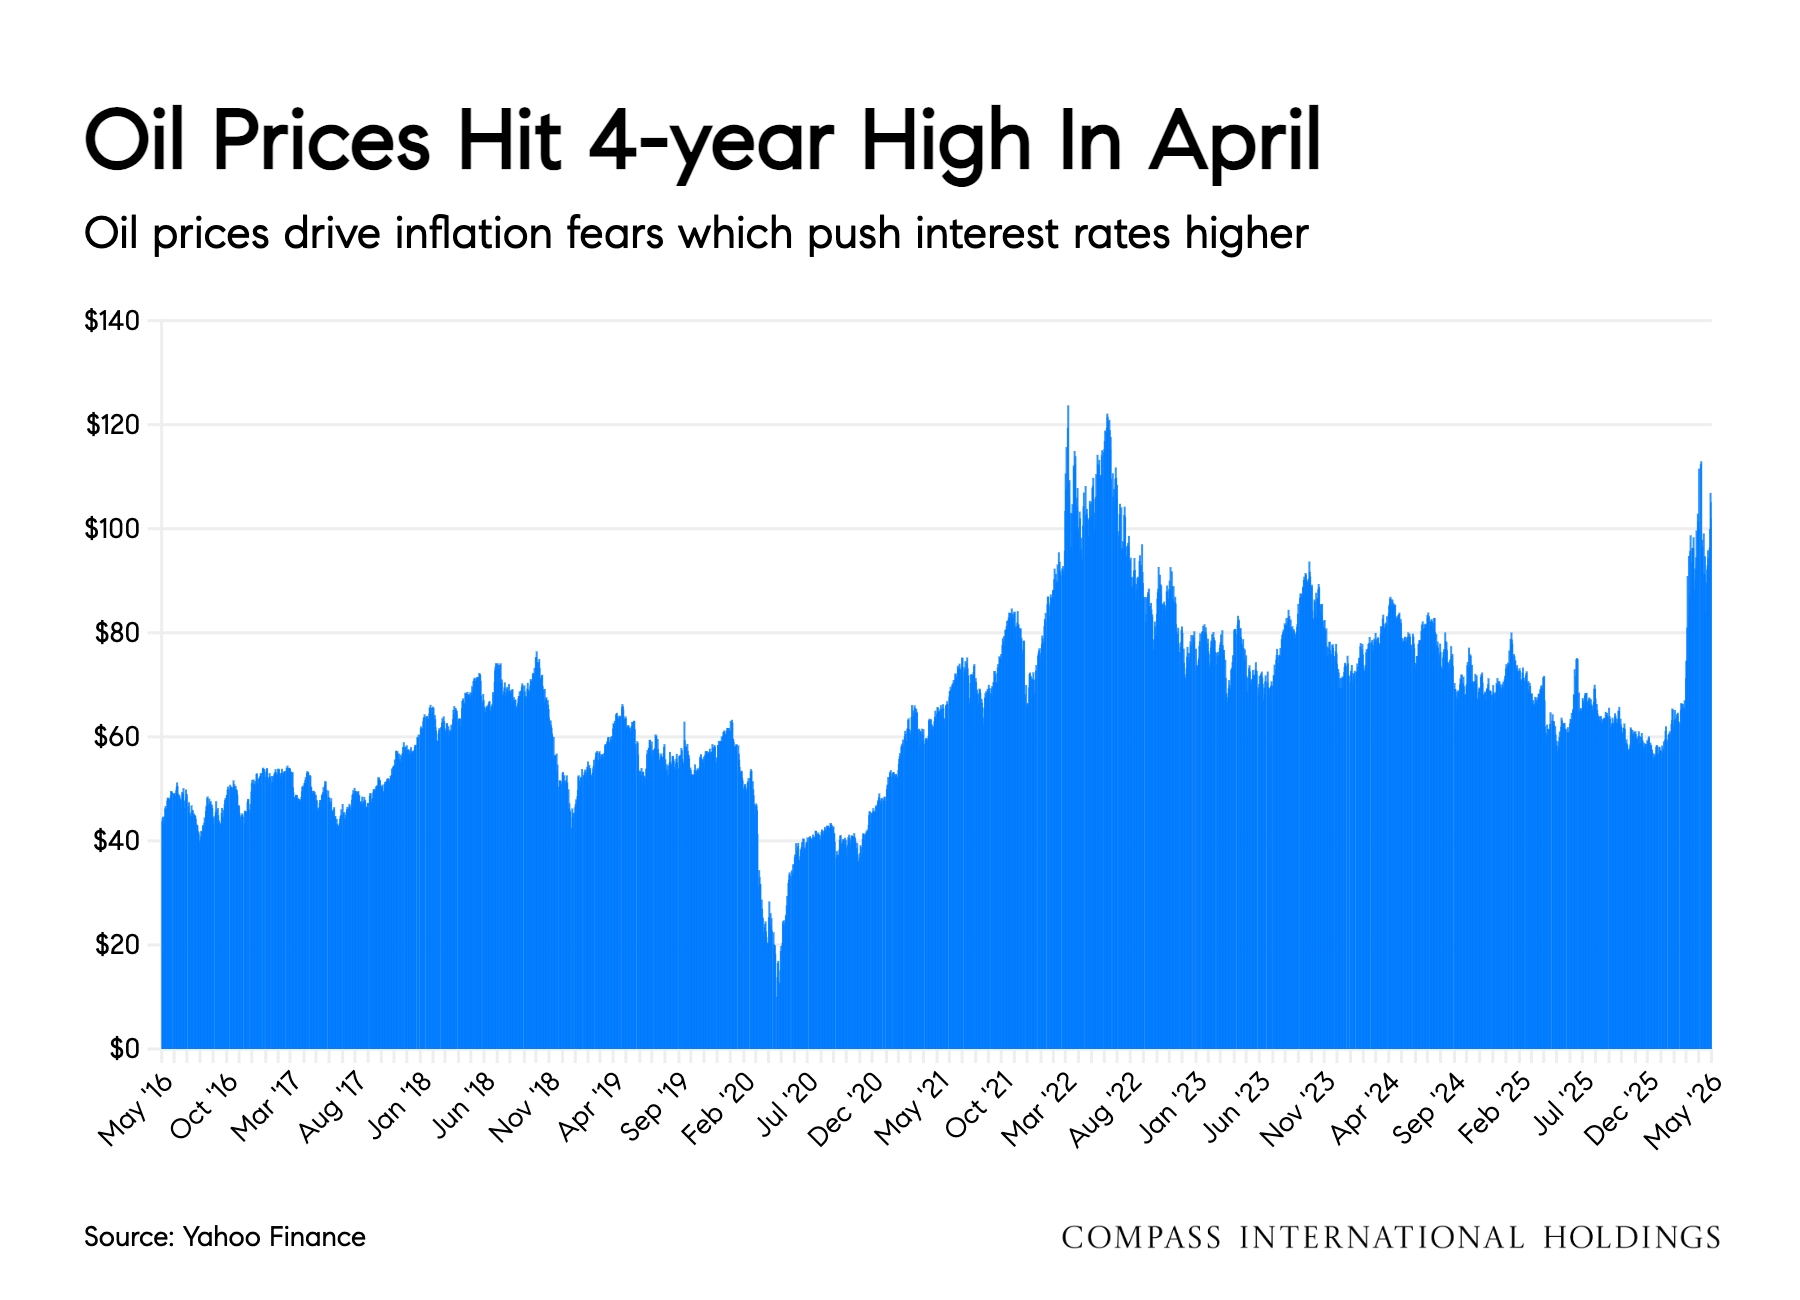
The crosswinds are significant. Oil prices have surged above $102 per barrel, the highest in four years, driven by the ongoing disruption in the Strait of Hormuz. National gas prices have climbed to $4.50 per gallon, the highest since 2022, per AAA. Inflation is re-accelerating, with the latest prints showing CPI at 3.3% and PCE at 3.5% per the Bureau of Labor Statistics and Bureau of Economic Analysis, both the highest readings since early 2024. Tariffs, energy costs, and government spending are all contributing to the upward pressure.
The Federal Reserve held rates steady at 3.50% to 3.75% at its April 29 meeting in a contentious 8-4 vote, the closest split since 1992. Most forecasters now expect no rate cuts until mid-2027. The 30-year fixed mortgage rate has ticked back up to 6.37% as of the May 7 Freddie Mac survey, up from 6.30% the prior week.
“The macro picture is more complicated than it was a month ago,” explains Mamola. “But the local market isn’t waiting for the Fed. Buyers with strong positions are acting now, and the overbidding numbers tell you they’re doing it with conviction.”
One of the most instructive charts in the Compass report tracks the mortgage rate lock-in dynamic. The current market rate for a 30-year fixed mortgage sits around 6.1%, while the average rate on all outstanding mortgages is 4.5%. That 1.6-percentage-point gap means that millions of homeowners nationwide (and thousands in San Francisco) would face a significantly higher payment if they sold and bought again, even at the same price point. The result is a structural constraint on supply that no single month of data can resolve.
Homebuilding is not picking up the slack. Permits, starts, and units under construction are all in multi-year declines nationally, according to U.S. Census Bureau data. In San Francisco specifically, new construction activity remains well below pre-pandemic levels. The result is a market where existing inventory is the primary playing field, and existing inventory is constrained by lock-in economics.
“Every conversation about when prices will soften starts and ends with supply,” Mamola adds. “Until either rates come down enough to unlock sellers or new construction catches up, the math favors the current dynamic.”
San Francisco Inventory |
For buyers, the April data offers a clear message: preparation is the price of admission. In a market where homes routinely sell for 25% or more above list, the difference between winning and losing an offer often comes down to the details. Fully underwritten financing, pre-read disclosures, and a disciplined contingency structure are no longer optional. They are the baseline expectation. Buyers in the mid-market segment (houses under $2 million and condos under $1.5 million) face the tightest conditions, as a large buyer pool competes for a shrinking number of listings.
For sellers, the overbidding data speaks louder than any headline. When Balboa Terrace is posting 166% sale-to-list and Inner Sunset 161%, the question is not whether conditions favor selling but whether preparation can maximize the outcome. The homes drawing the strongest responses this spring are those that come to market fully staged, pre-inspected, and priced to invite multiple offers. Sellers who have been waiting for the right moment are looking at some of the most favorable conditions in four years.
For the luxury segment, particularly the high-rise condo corridor stretching through South Beach, Yerba Buena, and Mission Bay, the spring market is showing renewed conviction. Jordan Park-Laurel Heights condos posted a median of $2.84 million, Presidio Heights $2.55 million, and the $1 million-plus condo market is active across a dozen neighborhoods. The AI-driven wealth effect in San Francisco is visible in both the equity markets and the real estate data, and it continues to provide a floor under upper-tier demand even as broader affordability pressures mount.
“The tension between local strength and macro risk is the defining feature of this spring,” Mamola observes. “The data says the window is open. The question for both buyers and sellers is whether they’re prepared to move through it.”
Considering a luxury condo purchase or home sale in San Francisco? Sean Mamola brings 17+ years of real estate expertise and a luxury hospitality background to every client relationship. As a Global Luxury Specialist with Compass focused on San Francisco’s premier high-rise communities and most desirable neighborhoods, Sean offers the market knowledge and personalized service that discerning buyers and sellers expect. Schedule a consultation or call (415) 704-3640.
Stay up to date on the latest real estate trends.

July 24, 2026
How Lower Pacific Heights condos are selling in 2026, for sellers.
July 23, 2026
What buyers should know about Lower Pacific Heights condos in 2026.
July 22, 2026
How Van Ness / Civic Center condos are selling in 2026, for sellers.
July 21, 2026
San Francisco's central value high-rise corridor, decoded for 2026 buyers.
July 20, 2026
Compare Mission Bay and SoMa condos for first-time buyers in San Francisco, from pricing and transit to lifestyle and inventory.
July 18, 2026
Deciding whether to sell or lease your Mission Bay condo? Compare market demand, HOA rules, taxes, and local costs to choose wisely.

Sean Mamola | July 16, 2026
When a condo loan stalls, it is usually the building, not the borrower. Here is how to get ahead of it.

Sean Mamola | July 15, 2026
San Francisco's top of market has gone vertical, and the condo market is quietly tightening underneath it.
July 13, 2026
Compare South Beach and East Cut for an investment condo in San Francisco, including HOA rules, renter fit, and building differences.

CONTACT SEAN MAMOLA AT RISES.CO
CA DRE# 02056250
891 Beach St.,
San Francisco CA 94109