San Francisco Real Estate Market Update: June Went Vertical
Sean Mamola | July 15, 2026
Sean Mamola | July 15, 2026
I have been selling San Francisco real estate for more than 17 years, and June was one of the strangest months I have watched. Forty-four homes in this city closed at least $1 million above their asking price. Not above the original list price, above the final ask. Together those buyers paid $60,033,495 more than sellers were asking, in a single month.
That is the headline, and it has earned it. But the number I keep coming back to is quieter. The citywide condo median rose 6% year over year in June, while single-family homes jumped 25%. Same city, same month, two completely different markets. If you own a condo here, or you want to, that gap is the most important thing in this report.
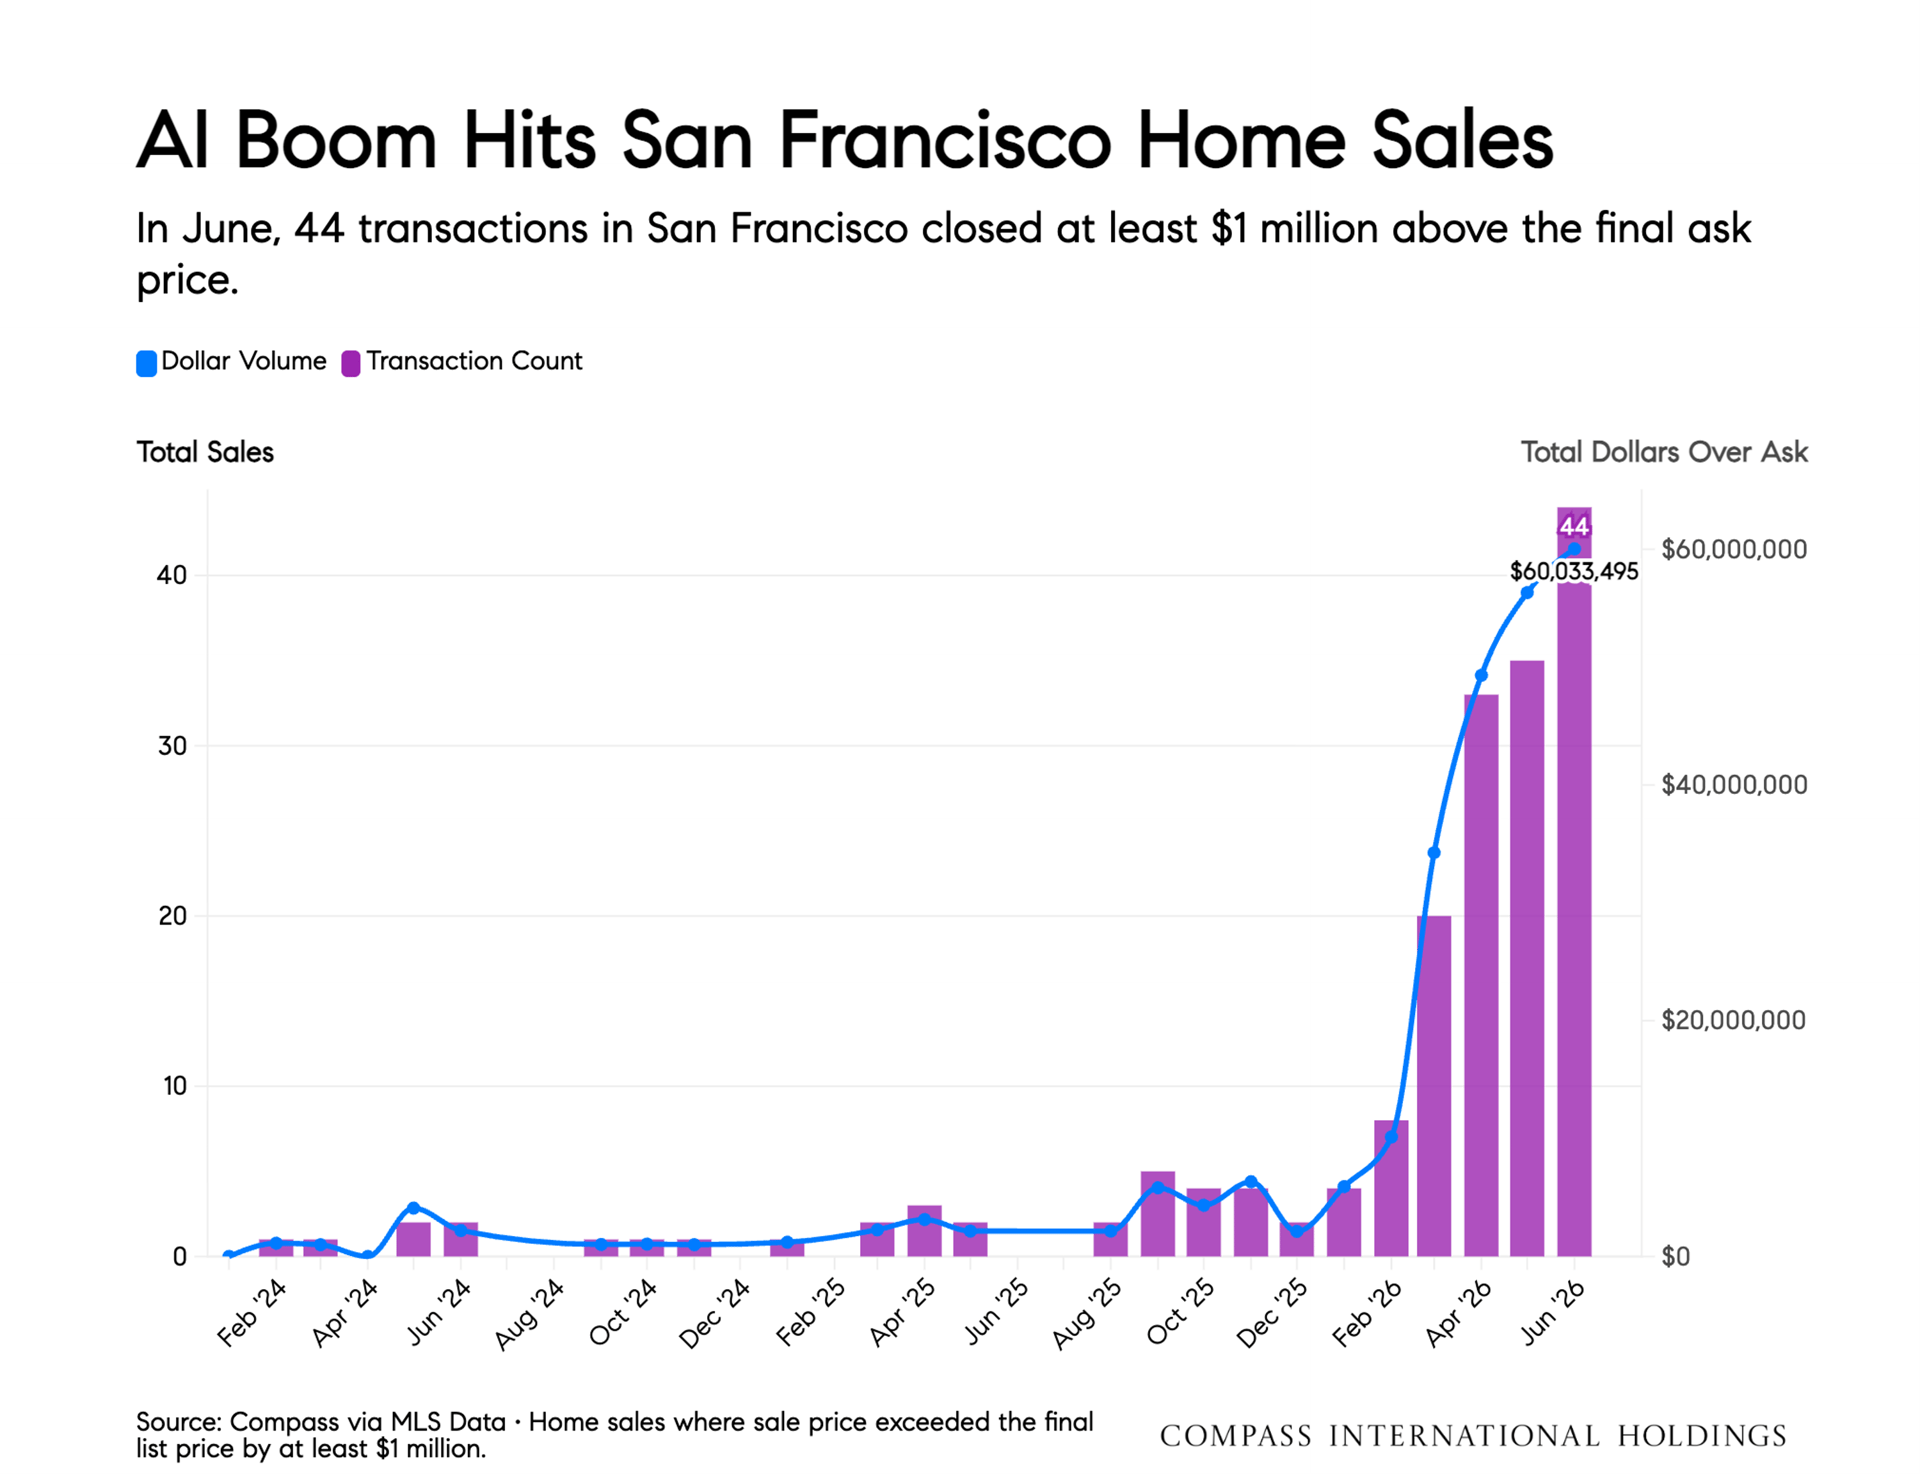
In a normal San Francisco year, one sale closing a million dollars over asking is the story of the month. Agents talk about it. It gets written up. In June it happened forty-four times.
What makes this remarkable is how fast it arrived. Through 2024 and most of 2025, a month with even a couple of these sales was unusual. The line was flat along the bottom of the chart for two years. Then it went vertical this spring, and June set the record. This is the AI wealth effect showing up in escrow, in real dollars, from buyers who are not financing their way to the top of a bidding war.
I want to be precise about what this is and is not. It is not the whole market rising 44 times over. It is a concentrated group of buyers with extraordinary liquidity competing for a very small number of homes. That distinction matters enormously depending on which part of the market you are standing in.
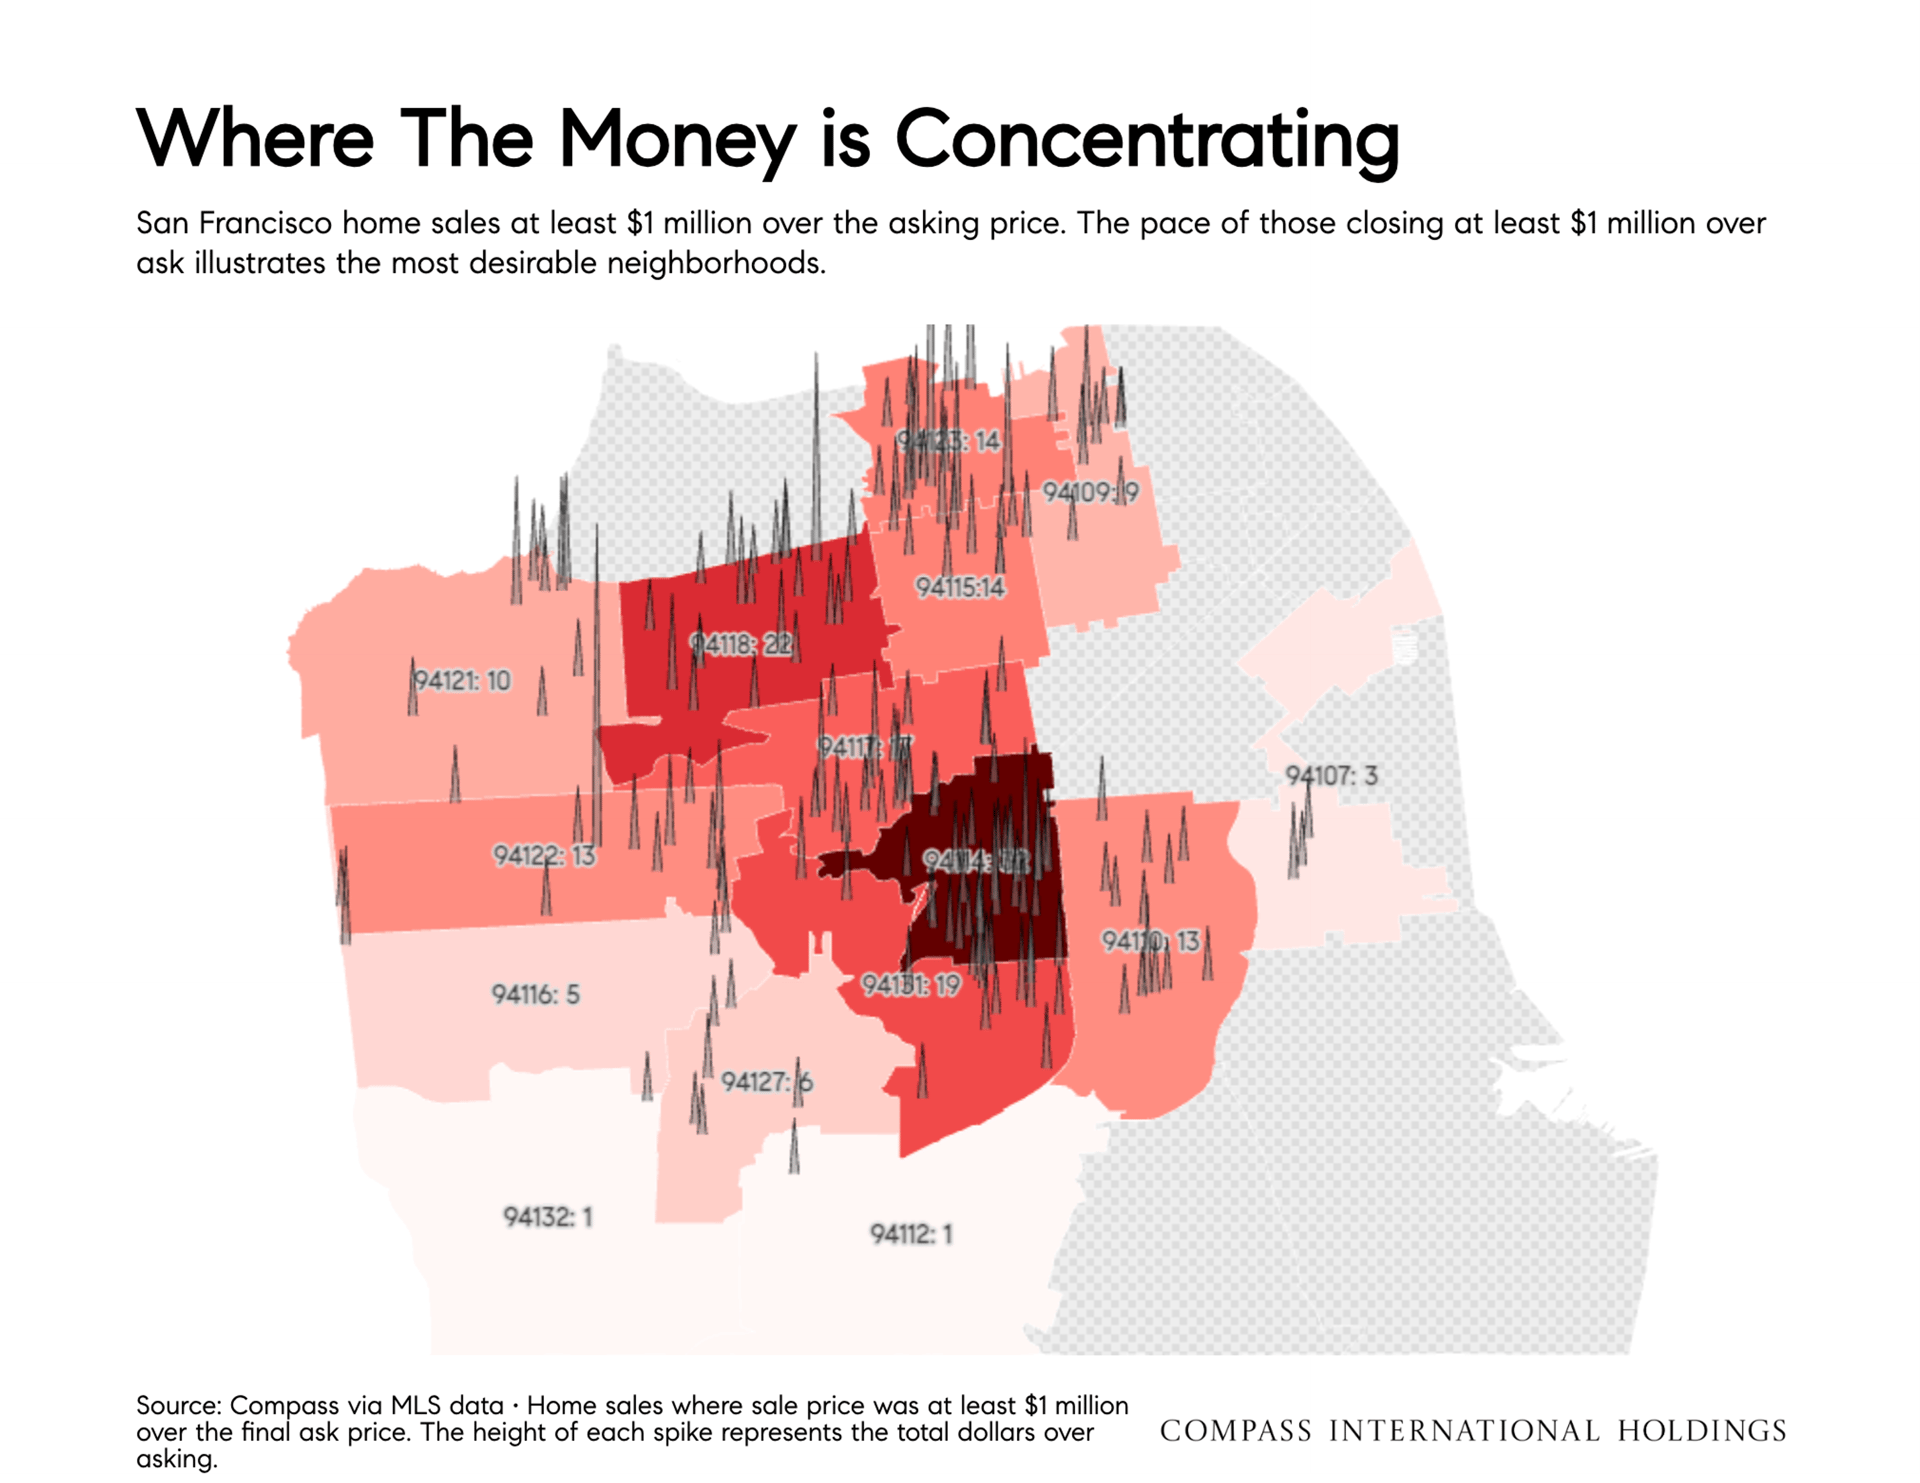
The report maps these sales by ZIP code, and the pattern tells you more than the total does. The 94118 ZIP, covering Inner Richmond and Laurel Heights, led the city with 22 sales that closed at least a million over ask. Russian Hill and the Nob Hill slopes in 94109 logged 19, matching Noe Valley and Glen Park in 94131. Pacific Heights and Lower Pacific Heights in 94115 recorded 14, as did the Marina and Cow Hollow in 94123.
Now the number that surprised me. The 94107 ZIP, which takes in South Beach, Mission Bay, and Potrero Hill, recorded three. Three, out of forty-four.
That is the waterfront high-rise corridor, the part of the city I work in most, and it is almost entirely absent from this frenzy. The money going a million over asking is buying houses in family neighborhoods, not view floors in glass towers. For anyone shopping the corridor right now, that is not bad news. It is the single best argument that value still exists here.
Underneath the spectacle, the broader market is simply running out of homes. June closed with a 92% absorption rate and roughly one month of inventory, with 590 active listings against 546 pending sales. One month of supply means that if nothing new were listed, the city would be sold out by the end of July.
All of this is happening with financing costs that should, in theory, be slowing things down. The 30-year fixed sat at 6.58%, in line with recent mortgage rate readings and near the low end of a three-year range that has run from 6.5% to 7.25%. It is still meaningfully above the 5.99% low from earlier this year, and with inflation still elevated, I am not counting on relief before the fall.
That is what makes this market unusual in my experience. Demand this strong usually needs cheap money behind it. This one does not have cheap money, and it is happening anyway.
Here is where I would focus if you own or want a condo. In June the single-family median rose 25% year over year. The condo median rose 6%, landing at $1,225,000. Both are up. They are not remotely the same market.
The rest of the condo numbers are genuinely encouraging. 314 condos closed in June, up from 278 in May and 260 in April, which is three straight months of accelerating volume. Average condo days on market dropped to 37, the fastest pace in years, though houses are still selling in 21. Price per square foot came in at $1,127 for condos against $1,230 for houses.
So condos are getting faster and busier without getting frothy. That is a healthier setup than it sounds. The buyers I am working with in the corridor are not bidding against a hedge fund of AI money. They are competing on price and terms with other normal buyers, in a market where supply is genuinely tight. You can still be strategic here. In a 94118 bidding war right now, strategy is mostly just a bigger check.
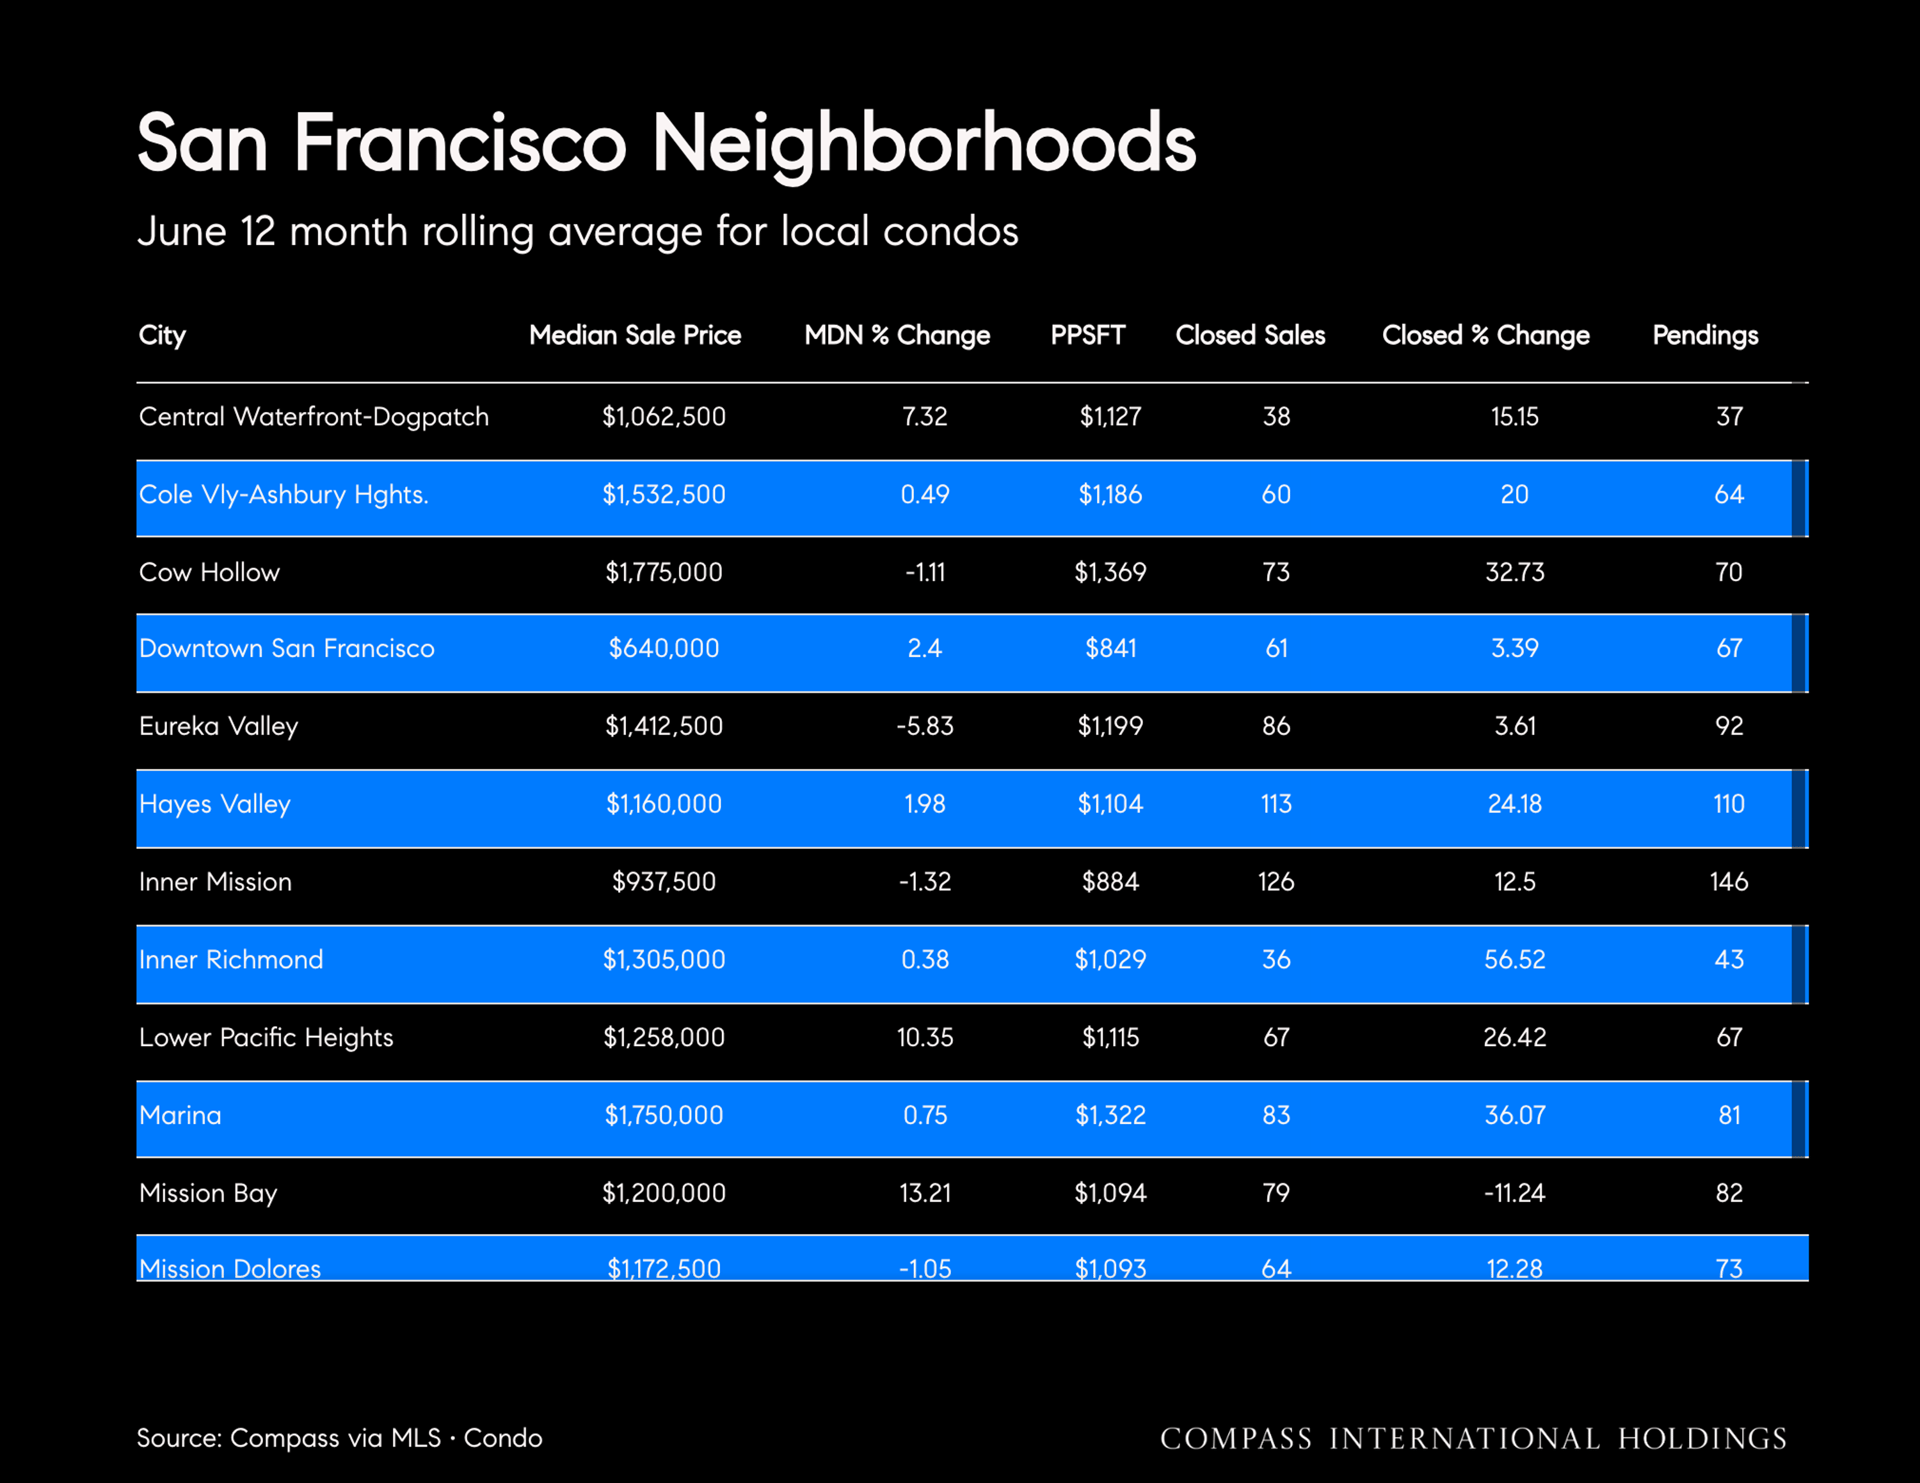
The neighborhood detail is where this gets useful, because the citywide condo median hides almost everything worth knowing.
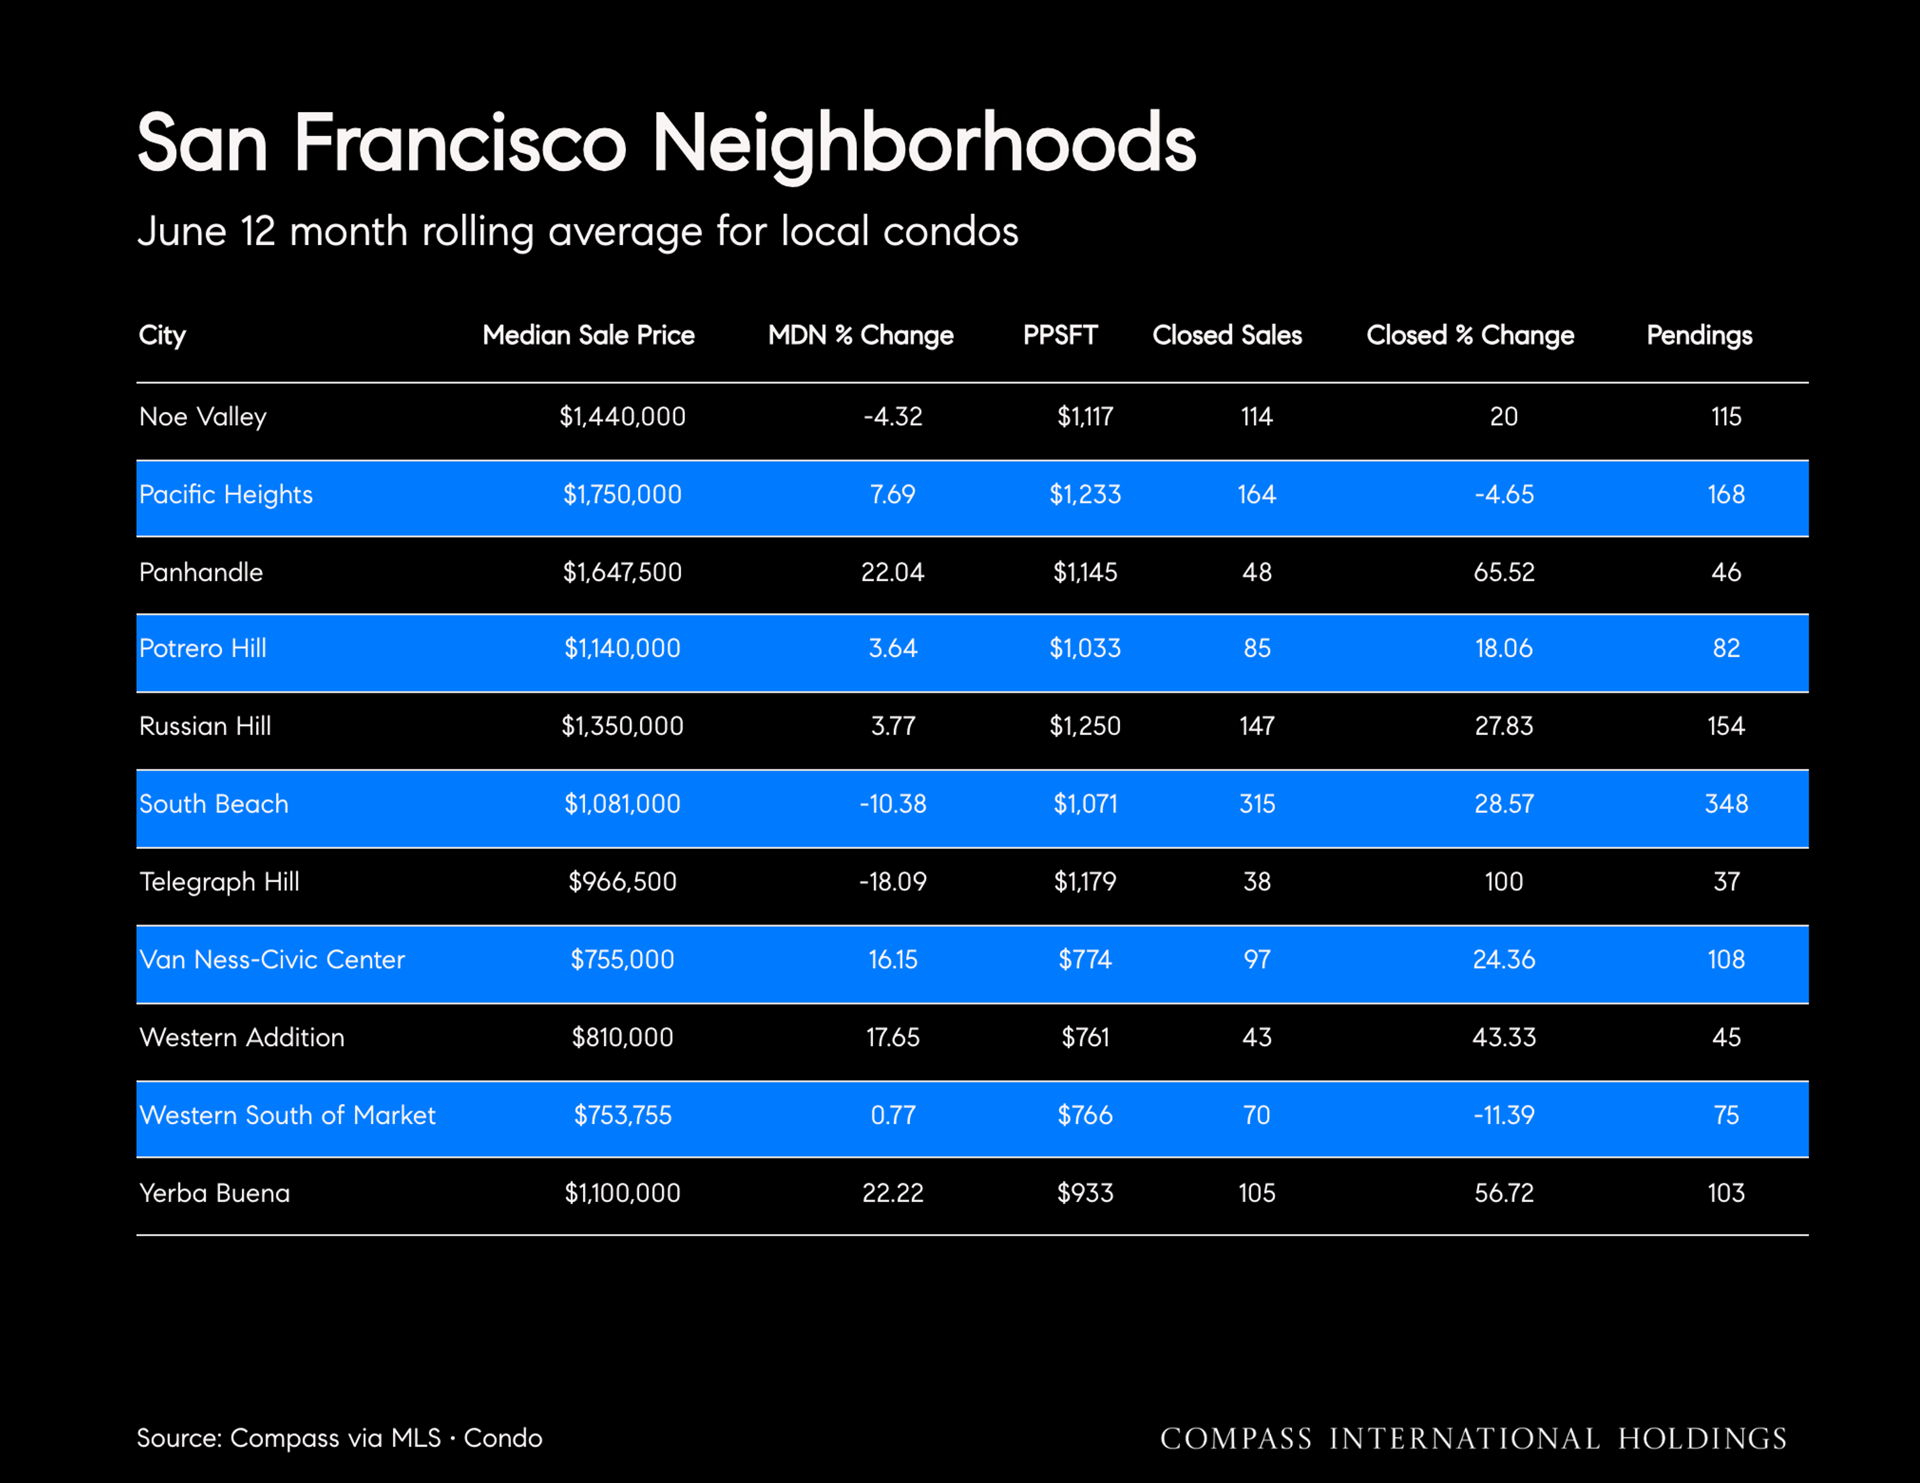
Yerba Buena posted the biggest gain of the neighborhoods I track, with the median up 22.22% to $1,100,000 and closed sales up 56.72%. Mission Bay rose 13.21% to $1,200,000, and Lower Pacific Heights climbed 10.35% to $1,258,000 on a 26.42% jump in closed sales. Pacific Heights remains the prestige benchmark at $1,750,000, up 7.69%, at $1,233 per square foot. Russian Hill reached $1,350,000, up 3.77%, with closed sales up 27.83%.
South Beach deserves a longer look, because at a glance it reads badly. The median fell 10.38% to $1,081,000. But closed sales rose 28.57% to 315, the deepest volume in the city, with 348 more in contract. A falling median with surging volume almost always means the mix has shifted, not that values collapsed. More entry-level and mid-floor units are trading, which pulls the median down while the neighborhood gets busier. If you own a view floor in South Beach, that headline number is not your number.
If you have been reading these reports, you have watched this build. Back in the winter, national prices were running about 1% higher year over year while San Francisco surged more than 16% in a single month, and condos had just reached their highest level since 2022. By March, the single-family median hit a then-record $2,150,000 and 24 condos sold above $3 million, up 380% from the prior year. In April, overbidding went citywide, with sale-to-list ratios above 125%.
Last month I wrote that the condo market had turned the corner, and that the recovery had broadened from a high-end spike into something market-wide. June says both things are still true, and adds a third. The top of the market has now separated from everything else entirely. Houses up 25%, condos up 6%, forty-four sales a million over ask, one month of inventory. The recovery is real, and it is no longer evenly distributed.
If you are buying a condo, this is a better moment than the headlines suggest. The frenzy is somewhere else. You are not competing with the buyer who just paid $2 million over ask in the Richmond. But you are competing in a market with one month of supply and days on market at 37, so preparation still decides outcomes. Get fully underwritten before you tour, know the building and its HOA before you write, and be ready to move in days rather than weeks. Yerba Buena and Lower Pacific Heights are where the momentum is right now. South Beach is where the selection is.
If you are selling, the tailwind is real but it is not evenly applied. Rising volume and one month of inventory mean a well-prepared home has less competition than it has had in years. It also means the market is discriminating. South Beach's mix shift is the warning: buyers are absorbing entry and mid-level inventory quickly while paying up only for the genuinely special. Price to the block and the floor, not to the citywide median, and lead with the things that cannot be replicated, which are the view, the light, and the outdoor space.
At the top of the market, the rules have changed. When forty-four homes clear a million over asking in one month, pricing a luxury property becomes an exercise in finding the ceiling rather than the comp. Those buyers are decisive, liquid, and largely rate-indifferent, and they are concentrated in a handful of ZIP codes. For a penthouse or a full-floor residence in the corridor, that means the buyer pool is thinner but far more capable than a year ago, and the deals that define this tier are increasingly the ones that never reach the open market.
If you are weighing a purchase or a sale right now, I would rather talk through your building and your block than have you plan around a citywide median that describes almost nobody. That is doubly true this month, when the same market delivered 25% gains to houses and 6% to condos. I bring 17+ years of experience and a luxury hospitality background to every client I work with, and I would be glad to tell you honestly whether this is your moment or not. Schedule a consultation or call me at (415) 704-3640.
Sean Mamola | Global Luxury Specialist, Compass | Rises.co | DRE 02056250

Primary phone
(415) 704-3640License Number
#02056250Address
891 Beach StSean Mamola is a San Francisco real estate agent who specializes in luxury properties and penthouses throughout the city's most coveted neighborhoods. As a Global Luxury Specialist with Compass and Rises.co, Sean works with discerning clients who are buying and selling exceptional properties in San Francisco. Since 2018 he has closed 75+ transactions and more than $100M in sales volume across the city's high-rise condo and penthouse market.
Sean focuses on San Francisco's premier areas including South Beach, Yerba Buena, Mission Bay, Pacific Heights, Lower Pacific Heights, Russian Hill, and Nob Hill. His deep knowledge of these neighborhoods allows him to guide clients to properties that perfectly match their lifestyle and investment goals.
Whether you're drawn to the modern luxury of South Beach condos, the urban sophistication of Yerba Buena, the waterfront appeal of Mission Bay, the timeless elegance of Pacific Heights, the historic charm of Russian Hill, or the prestigious heights of Nob Hill, Sean understands what makes each area unique.
For Sellers
Sean creates comprehensive marketing strategies that attract qualified buyers with refined tastes. He believes in elegant staging with meticulous attention to detail, ensuring your property makes an unforgettable impression. His marketing reaches both international and local luxury markets, maximizing exposure for condos, penthouses, condotels, and new developments.
For Buyers
Using cutting-edge technology and market research, Sean carefully analyzes pricing and property trends to find homes that satisfy his clients' specific preferences, price points, and lifestyles. His 24/7 availability and white-glove service ensure you never miss the right opportunity.
Working with Sean and his partnership with Rises.co gives clients significant competitive advantages. His vast network of interconnected agents results in winning offers and an impressively low ratio of properties shown to offers accepted. Sean's impeccable work ethic and precise negotiation skills ensure sellers find the right buyer and buyers secure their dream home.
Before becoming a licensed real estate agent, Sean spent years in luxury hospitality, skills he applies to every client relationship and transaction. He has tremendous respect for people's privacy and consistently exceeds expectations – from international travel to execute transactions to handling unique special requests.
As a Bay Area native who lived in New York City for 15 years, Sean brings a global perspective and genuine appreciation for people from all walks of life. His diverse background helps him connect with clients whether they're local San Francisco residents or international buyers seeking their perfect property.
When not working, Sean enjoys cycling, spending time with his large Irish-Italian family, and volunteering for Food Runners, The Richmond/Ermet Aid Foundation (REAF), and Broadway Cares/Equity Fights AIDS. This community involvement reflects his commitment to giving back to the city he serves.
If you're looking for an exceptional San Francisco real estate agent who specializes in luxury properties and provides truly high-touch service, let's talk. Sean is ready to help you find your perfect San Francisco home or achieve the best possible outcome when selling your property.
Specializing in luxury condos, penthouses, and exceptional properties in South Beach, Yerba Buena, Mission Bay, Pacific Heights, Lower Pacific Heights, Russian Hill, and Nob Hill.
Stay up to date on the latest real estate trends.
Sean Mamola | October 23, 2026
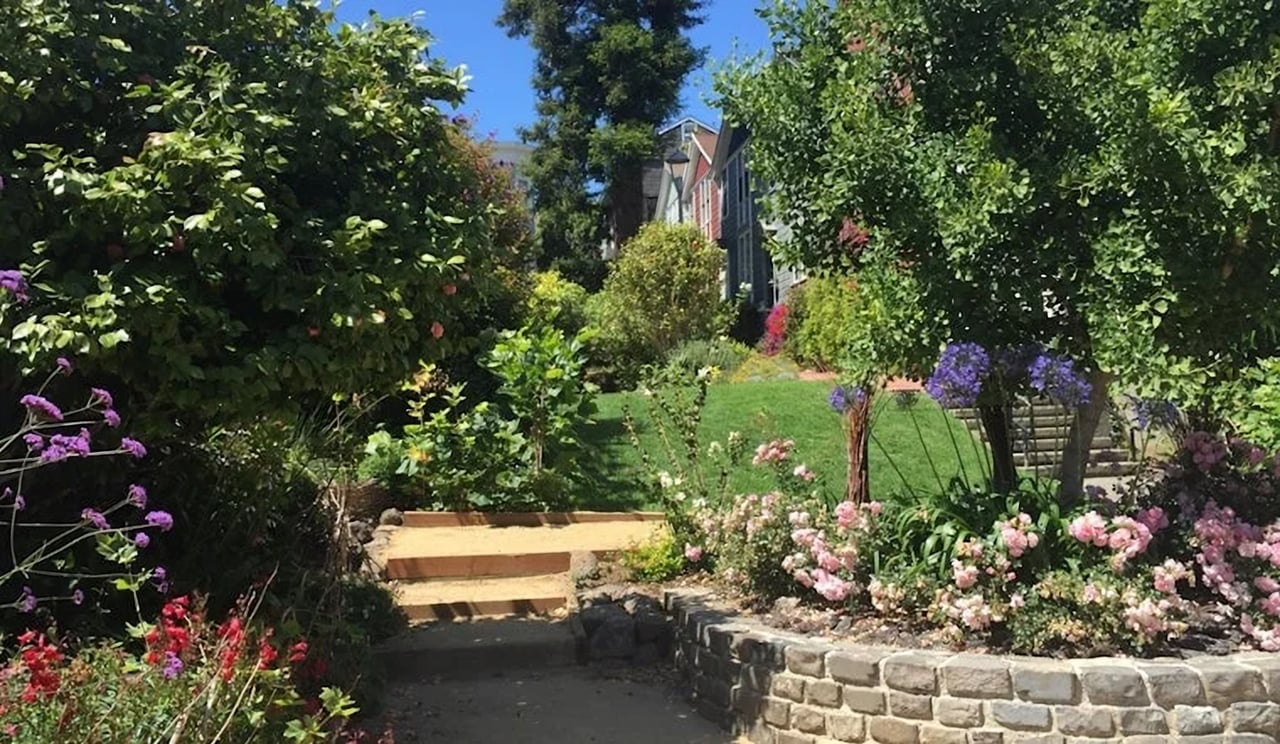
A car-free brick walkway, a row of 1882 cottages, and the "Japan Street" story every owner nearby should know.
Sean Mamola | October 22, 2026
A Saturday Halloween runs from a Church Street dog parade to Fair Oaks after dark
Sean Mamola | October 19, 2026
Off-market or on the MLS? A 2026 guide for San Francisco condo sellers.

Sean Mamola | October 16, 2026
How a 1031 exchange defers capital gains on a San Francisco investment property.

Sean Mamola | October 15, 2026
One construction fence comes down, and another goes up across Post Street.
Sean Mamola | October 15, 2026
The disclosures and reports a San Francisco seller must provide in 2026.
Sean Mamola | October 14, 2026
What Yerba Buena condo buyers need to know in 2026: value, buildings, and leverage.
Sean Mamola | October 13, 2026
What Mission Bay condo buyers need to know in 2026: prices, buildings, and pace.

Sean Mamola | October 12, 2026
Two-thirds of condos sold over asking and the median rose 23%. Then mortgage rates climbed to 7.40%. Here's how I'm reading both.
CONTACT SEAN MAMOLA AT RISES.CO
CA DRE# 02056250
891 Beach St.,
San Francisco CA 94109